Combined Buffer Requirement (Banking sector, total) - ekonomika ČNB
Aktualizace dat Combined Buffer Requirement (Banking sector, total) v této aplikaci skončila 30.6.2023. Aktualizovná data časových řad najdete na stránkách nové aplikace z dat ARAD ČNB
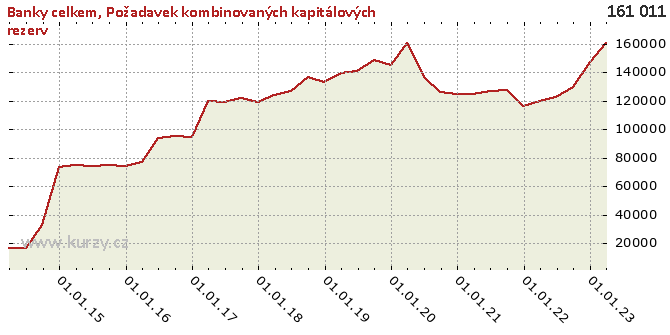
Graf hodnot, Banking sector, total
Meziroční srovnání
Minima a maxima
| Typ | Období | Hodnota |
|---|---|---|
| Max | 31.03.2020 | 160 870.00 |
| Min | 30.06.2014 | 16 417.00 |
Historické hodnoty
| Období | Hodnota | Předchozí | Rozdíl | Změna | Před rokem | Rozdíl | Změna |
|---|---|---|---|---|---|---|---|
| 31.03.2020 | 160 870.00 | 145 175.00 | 15 695.00 | 10.81% | 139 712.00 | 21 158.00 | 15.14% |
| 31.12.2019 | 145 175.00 | 148 947.00 | -3 772.00 | -2.53% | 133 248.00 | 11 927.00 | 8.95% |
| 30.09.2019 | 148 947.00 | 140 880.00 | 8 067.00 | 5.73% | 136 557.00 | 12 390.00 | 9.07% |
| 30.06.2019 | 140 880.00 | 139 712.00 | 1 168.00 | 0.84% | 126 986.00 | 13 894.00 | 10.94% |
| 31.03.2019 | 139 712.00 | 133 248.00 | 6 464.00 | 4.85% | 124 247.00 | 15 465.00 | 12.45% |
| 31.12.2018 | 133 248.00 | 136 557.00 | -3 309.00 | -2.42% | 119 142.00 | 14 106.00 | 11.84% |
| 30.09.2018 | 136 557.00 | 126 986.00 | 9 571.00 | 7.54% | 121 763.00 | 14 794.00 | 12.15% |
| 30.06.2018 | 126 986.00 | 124 247.00 | 2 739.00 | 2.20% | 119 528.00 | 7 458.00 | 6.24% |
| 31.03.2018 | 124 247.00 | 119 142.00 | 5 105.00 | 4.28% | 120 061.00 | 4 186.00 | 3.49% |
| 31.12.2017 | 119 142.00 | 121 763.00 | -2 621.00 | -2.15% | 94 549.00 | 24 593.00 | 26.01% |
| 30.09.2017 | 121 763.00 | 119 528.00 | 2 235.00 | 1.87% | 95 154.00 | 26 609.00 | 27.96% |
| 30.06.2017 | 119 528.00 | 120 061.00 | - 533.00 | -0.44% | 94 086.00 | 25 442.00 | 27.04% |
| 31.03.2017 | 120 061.00 | 94 549.00 | 25 512.00 | 26.98% | 76 896.00 | 43 165.00 | 56.13% |
| 31.12.2016 | 94 549.00 | 95 154.00 | - 605.00 | -0.64% | 74 452.00 | 20 097.00 | 26.99% |
| 30.09.2016 | 95 154.00 | 94 086.00 | 1 068.00 | 1.14% | 75 342.00 | 19 812.00 | 26.30% |
| 30.06.2016 | 94 086.00 | 76 896.00 | 17 190.00 | 22.35% | 74 530.00 | 19 556.00 | 26.24% |
| 31.03.2016 | 76 896.00 | 74 452.00 | 2 444.00 | 3.28% | 75 147.00 | 1 749.00 | 2.33% |
| 31.12.2015 | 74 452.00 | 75 342.00 | - 890.00 | -1.18% | 73 818.00 | 634.00 | 0.86% |
| 30.09.2015 | 75 342.00 | 74 530.00 | 812.00 | 1.09% | 32 650.00 | 42 692.00 | 130.76% |
| 30.06.2015 | 74 530.00 | 75 147.00 | - 617.00 | -0.82% | 16 417.00 | 58 113.00 | 353.98% |
| 31.03.2015 | 75 147.00 | 73 818.00 | 1 329.00 | 1.80% | 16 500.00 | 58 647.00 | 355.44% |
| 31.12.2014 | 73 818.00 | 32 650.00 | 41 168.00 | 126.09% | - | - | - |
| 30.09.2014 | 32 650.00 | 16 417.00 | 16 233.00 | 98.88% | - | - | - |
| 30.06.2014 | 16 417.00 | 16 500.00 | -83.00 | -0.50% | - | - | - |
| 31.03.2014 | 16 500.00 | - | - | - | - | - | - |
Graf jako obrázek

Podobné sestavy
Aplikace Ekonomika ČNB ze sekce makroekonomika zobrazuje časové řady hlavních makroekonomických údajů z ekonomiky ČR. Najdete zde přes 10.000 grafů různých hodnot od úrokových sazeb, přes statistiky státního rozpočtu, statistiky ČNB a data zpracovávaná ČSÚ. Data jsou k dispozici obvykle za posledních více než 20 let, od prosince roku 1992. Zdroj dat: ČNB ARAD

