Financial guarantees given (Banking sector, total) - ekonomika ČNB
Aktualizace dat Financial guarantees given (Banking sector, total) v této aplikaci skončila 30.6.2023. Aktualizovná data časových řad najdete na stránkách nové aplikace z dat ARAD ČNB
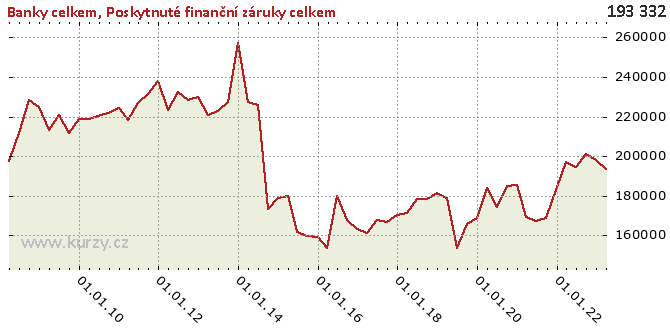
Graf hodnot, Banking sector, total
Meziroční srovnání
Minima a maxima
| Typ | Období | Hodnota |
|---|---|---|
| Min | 31.03.2016 | 153 303.00 |
| Max | 31.12.2013 | 257 380.00 |
Historické hodnoty
| Období | Hodnota | Předchozí | Rozdíl | Změna | Před rokem | Rozdíl | Změna |
|---|---|---|---|---|---|---|---|
| 31.03.2020 | 183 725.00 | 168 629.00 | 15 096.00 | 8.95% | 178 600.00 | 5 125.00 | 2.87% |
| 31.12.2019 | 168 629.00 | 165 464.00 | 3 165.00 | 1.91% | 181 364.00 | -12 735.00 | -7.02% |
| 30.09.2019 | 165 464.00 | 153 505.00 | 11 959.00 | 7.79% | 178 283.00 | -12 819.00 | -7.19% |
| 30.06.2019 | 153 505.00 | 178 600.00 | -25 095.00 | -14.05% | 178 241.00 | -24 736.00 | -13.88% |
| 31.03.2019 | 178 600.00 | 181 364.00 | -2 764.00 | -1.52% | 171 144.00 | 7 456.00 | 4.36% |
| 31.12.2018 | 181 364.00 | 178 283.00 | 3 081.00 | 1.73% | 170 365.00 | 10 999.00 | 6.46% |
| 30.09.2018 | 178 283.00 | 178 241.00 | 42.00 | 0.02% | 166 886.00 | 11 397.00 | 6.83% |
| 30.06.2018 | 178 241.00 | 171 144.00 | 7 097.00 | 4.15% | 167 885.00 | 10 356.00 | 6.17% |
| 31.03.2018 | 171 144.00 | 170 365.00 | 779.00 | 0.46% | 161 304.00 | 9 840.00 | 6.10% |
| 31.12.2017 | 170 365.00 | 166 886.00 | 3 479.00 | 2.08% | 163 274.00 | 7 091.00 | 4.34% |
| 30.09.2017 | 166 886.00 | 167 885.00 | - 999.00 | -0.59% | 167 637.00 | - 751.00 | -0.45% |
| 30.06.2017 | 167 885.00 | 161 304.00 | 6 581.00 | 4.08% | 179 640.00 | -11 755.00 | -6.54% |
| 31.03.2017 | 161 304.00 | 163 274.00 | -1 970.00 | -1.21% | 153 303.00 | 8 001.00 | 5.22% |
| 31.12.2016 | 163 274.00 | 167 637.00 | -4 363.00 | -2.60% | 159 193.00 | 4 081.00 | 2.56% |
| 30.09.2016 | 167 637.00 | 179 640.00 | -12 003.00 | -6.68% | 159 572.00 | 8 065.00 | 5.05% |
| 30.06.2016 | 179 640.00 | 153 303.00 | 26 337.00 | 17.18% | 161 402.00 | 18 238.00 | 11.30% |
| 31.03.2016 | 153 303.00 | 159 193.00 | -5 890.00 | -3.70% | 179 572.00 | -26 269.00 | -14.63% |
| 31.12.2015 | 159 193.00 | 159 572.00 | - 379.00 | -0.24% | 179 042.00 | -19 849.00 | -11.09% |
| 30.09.2015 | 159 572.00 | 161 402.00 | -1 830.00 | -1.13% | 173 013.00 | -13 441.00 | -7.77% |
| 30.06.2015 | 161 402.00 | 179 572.00 | -18 170.00 | -10.12% | 226 071.00 | -64 669.00 | -28.61% |
| 31.03.2015 | 179 572.00 | 179 042.00 | 530.00 | 0.30% | 227 294.00 | -47 722.00 | -21.00% |
| 31.12.2014 | 179 042.00 | 173 013.00 | 6 029.00 | 3.48% | 257 380.00 | -78 338.00 | -30.44% |
| 30.09.2014 | 173 013.00 | 226 071.00 | -53 058.00 | -23.47% | 227 311.00 | -54 298.00 | -23.89% |
| 30.06.2014 | 226 071.00 | 227 294.00 | -1 223.00 | -0.54% | 222 597.00 | 3 474.00 | 1.56% |
| 31.03.2014 | 227 294.00 | 257 380.00 | -30 086.00 | -11.69% | 220 720.00 | 6 574.00 | 2.98% |
| 31.12.2013 | 257 380.00 | 227 311.00 | 30 069.00 | 13.23% | 229 671.00 | 27 709.00 | 12.06% |
| 30.09.2013 | 227 311.00 | 222 597.00 | 4 714.00 | 2.12% | 228 459.00 | -1 148.00 | -0.50% |
| 30.06.2013 | 222 597.00 | 220 720.00 | 1 877.00 | 0.85% | 232 208.00 | -9 611.00 | -4.14% |
| 31.03.2013 | 220 720.00 | 229 671.00 | -8 951.00 | -3.90% | 223 513.00 | -2 793.00 | -1.25% |
| 31.12.2012 | 229 671.00 | 228 459.00 | 1 212.00 | 0.53% | 237 921.00 | -8 250.00 | -3.47% |
| 30.09.2012 | 228 459.00 | 232 208.00 | -3 749.00 | -1.61% | 231 401.00 | -2 942.00 | -1.27% |
| 30.06.2012 | 232 208.00 | 223 513.00 | 8 695.00 | 3.89% | 226 584.00 | 5 624.00 | 2.48% |
| 31.03.2012 | 223 513.00 | 237 921.00 | -14 408.00 | -6.06% | 218 286.00 | 5 227.00 | 2.39% |
| 31.12.2011 | 237 921.00 | 231 401.00 | 6 520.00 | 2.82% | 224 242.00 | 13 679.00 | 6.10% |
| 30.09.2011 | 231 401.00 | 226 584.00 | 4 817.00 | 2.13% | 221 613.00 | 9 788.00 | 4.42% |
| 30.06.2011 | 226 584.00 | 218 286.00 | 8 298.00 | 3.80% | 220 316.00 | 6 268.00 | 2.85% |
| 31.03.2011 | 218 286.00 | 224 242.00 | -5 956.00 | -2.66% | 218 538.00 | - 252.00 | -0.12% |
| 31.12.2010 | 224 242.00 | 221 613.00 | 2 629.00 | 1.19% | 218 944.00 | 5 298.00 | 2.42% |
| 30.09.2010 | 221 613.00 | 220 316.00 | 1 297.00 | 0.59% | 211 755.00 | 9 858.00 | 4.66% |
| 30.06.2010 | 220 316.00 | 218 538.00 | 1 778.00 | 0.81% | 220 577.00 | - 261.00 | -0.12% |
| 31.03.2010 | 218 538.00 | 218 944.00 | - 406.00 | -0.19% | 213 167.00 | 5 371.00 | 2.52% |
| 31.12.2009 | 218 944.00 | 211 755.00 | 7 189.00 | 3.39% | 224 758.00 | -5 814.00 | -2.59% |
| 30.09.2009 | 211 755.00 | 220 577.00 | -8 822.00 | -4.00% | 228 471.00 | -16 716.00 | -7.32% |
| 30.06.2009 | 220 577.00 | 213 167.00 | 7 410.00 | 3.48% | 211 742.00 | 8 835.00 | 4.17% |
| 31.03.2009 | 213 167.00 | 224 758.00 | -11 591.00 | -5.16% | 197 498.00 | 15 669.00 | 7.93% |
| 31.12.2008 | 224 758.00 | 228 471.00 | -3 713.00 | -1.63% | - | - | - |
| 30.09.2008 | 228 471.00 | 211 742.00 | 16 729.00 | 7.90% | - | - | - |
| 30.06.2008 | 211 742.00 | 197 498.00 | 14 244.00 | 7.21% | - | - | - |
| 31.03.2008 | 197 498.00 | - | - | - | - | - | - |
Graf jako obrázek

Podobné sestavy
Aplikace Ekonomika ČNB ze sekce makroekonomika zobrazuje časové řady hlavních makroekonomických údajů z ekonomiky ČR. Najdete zde přes 10.000 grafů různých hodnot od úrokových sazeb, přes statistiky státního rozpočtu, statistiky ČNB a data zpracovávaná ČSÚ. Data jsou k dispozici obvykle za posledních více než 20 let, od prosince roku 1992. Zdroj dat: ČNB ARAD

