Financial guarantees received (Banking sector, total) - ekonomika ČNB
Aktualizace dat Financial guarantees received (Banking sector, total) v této aplikaci skončila 30.6.2023. Aktualizovná data časových řad najdete na stránkách nové aplikace z dat ARAD ČNB
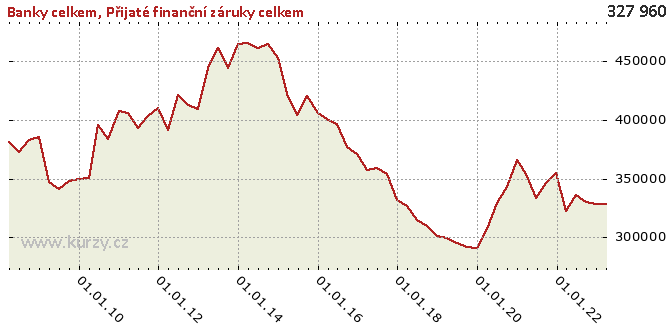
Graf hodnot, Banking sector, total
Meziroční srovnání
Minima a maxima
| Typ | Období | Hodnota |
|---|---|---|
| Min | 31.12.2019 | 290 535.00 |
| Max | 31.03.2014 | 465 731.00 |
Historické hodnoty
| Období | Hodnota | Předchozí | Rozdíl | Změna | Před rokem | Rozdíl | Změna |
|---|---|---|---|---|---|---|---|
| 31.03.2020 | 307 083.00 | 290 535.00 | 16 548.00 | 5.70% | 299 646.00 | 7 437.00 | 2.48% |
| 31.12.2019 | 290 535.00 | 291 858.00 | -1 323.00 | -0.45% | 301 169.00 | -10 634.00 | -3.53% |
| 30.09.2019 | 291 858.00 | 294 789.00 | -2 931.00 | -0.99% | 309 978.00 | -18 120.00 | -5.85% |
| 30.06.2019 | 294 789.00 | 299 646.00 | -4 857.00 | -1.62% | 314 891.00 | -20 102.00 | -6.38% |
| 31.03.2019 | 299 646.00 | 301 169.00 | -1 523.00 | -0.51% | 326 402.00 | -26 756.00 | -8.20% |
| 31.12.2018 | 301 169.00 | 309 978.00 | -8 809.00 | -2.84% | 331 516.00 | -30 347.00 | -9.15% |
| 30.09.2018 | 309 978.00 | 314 891.00 | -4 913.00 | -1.56% | 353 675.00 | -43 697.00 | -12.36% |
| 30.06.2018 | 314 891.00 | 326 402.00 | -11 511.00 | -3.53% | 358 830.00 | -43 939.00 | -12.24% |
| 31.03.2018 | 326 402.00 | 331 516.00 | -5 114.00 | -1.54% | 357 398.00 | -30 996.00 | -8.67% |
| 31.12.2017 | 331 516.00 | 353 675.00 | -22 159.00 | -6.27% | 371 076.00 | -39 560.00 | -10.66% |
| 30.09.2017 | 353 675.00 | 358 830.00 | -5 155.00 | -1.44% | 376 512.00 | -22 837.00 | -6.07% |
| 30.06.2017 | 358 830.00 | 357 398.00 | 1 432.00 | 0.40% | 396 326.00 | -37 496.00 | -9.46% |
| 31.03.2017 | 357 398.00 | 371 076.00 | -13 678.00 | -3.69% | 400 869.00 | -43 471.00 | -10.84% |
| 31.12.2016 | 371 076.00 | 376 512.00 | -5 436.00 | -1.44% | 405 794.00 | -34 718.00 | -8.56% |
| 30.09.2016 | 376 512.00 | 396 326.00 | -19 814.00 | -5.00% | 420 087.00 | -43 575.00 | -10.37% |
| 30.06.2016 | 396 326.00 | 400 869.00 | -4 543.00 | -1.13% | 404 322.00 | -7 996.00 | -1.98% |
| 31.03.2016 | 400 869.00 | 405 794.00 | -4 925.00 | -1.21% | 419 715.00 | -18 846.00 | -4.49% |
| 31.12.2015 | 405 794.00 | 420 087.00 | -14 293.00 | -3.40% | 452 263.00 | -46 469.00 | -10.27% |
| 30.09.2015 | 420 087.00 | 404 322.00 | 15 765.00 | 3.90% | 464 941.00 | -44 854.00 | -9.65% |
| 30.06.2015 | 404 322.00 | 419 715.00 | -15 393.00 | -3.67% | 461 045.00 | -56 723.00 | -12.30% |
| 31.03.2015 | 419 715.00 | 452 263.00 | -32 548.00 | -7.20% | 465 731.00 | -46 016.00 | -9.88% |
| 31.12.2014 | 452 263.00 | 464 941.00 | -12 678.00 | -2.73% | 464 711.00 | -12 448.00 | -2.68% |
| 30.09.2014 | 464 941.00 | 461 045.00 | 3 896.00 | 0.84% | 444 108.00 | 20 833.00 | 4.69% |
| 30.06.2014 | 461 045.00 | 465 731.00 | -4 686.00 | -1.01% | 461 003.00 | 42.00 | 0.01% |
| 31.03.2014 | 465 731.00 | 464 711.00 | 1 020.00 | 0.22% | 444 129.00 | 21 602.00 | 4.86% |
| 31.12.2013 | 464 711.00 | 444 108.00 | 20 603.00 | 4.64% | 409 340.00 | 55 371.00 | 13.53% |
| 30.09.2013 | 444 108.00 | 461 003.00 | -16 895.00 | -3.66% | 412 323.00 | 31 785.00 | 7.71% |
| 30.06.2013 | 461 003.00 | 444 129.00 | 16 874.00 | 3.80% | 420 909.00 | 40 094.00 | 9.53% |
| 31.03.2013 | 444 129.00 | 409 340.00 | 34 789.00 | 8.50% | 391 732.00 | 52 397.00 | 13.38% |
| 31.12.2012 | 409 340.00 | 412 323.00 | -2 983.00 | -0.72% | 410 000.00 | - 660.00 | -0.16% |
| 30.09.2012 | 412 323.00 | 420 909.00 | -8 586.00 | -2.04% | 403 563.00 | 8 760.00 | 2.17% |
| 30.06.2012 | 420 909.00 | 391 732.00 | 29 177.00 | 7.45% | 392 875.00 | 28 034.00 | 7.14% |
| 31.03.2012 | 391 732.00 | 410 000.00 | -18 268.00 | -4.46% | 405 783.00 | -14 051.00 | -3.46% |
| 31.12.2011 | 410 000.00 | 403 563.00 | 6 437.00 | 1.59% | 407 201.00 | 2 799.00 | 0.69% |
| 30.09.2011 | 403 563.00 | 392 875.00 | 10 688.00 | 2.72% | 383 563.00 | 20 000.00 | 5.21% |
| 30.06.2011 | 392 875.00 | 405 783.00 | -12 908.00 | -3.18% | 395 956.00 | -3 081.00 | -0.78% |
| 31.03.2011 | 405 783.00 | 407 201.00 | -1 418.00 | -0.35% | 350 775.00 | 55 008.00 | 15.68% |
| 31.12.2010 | 407 201.00 | 383 563.00 | 23 638.00 | 6.16% | 349 688.00 | 57 513.00 | 16.45% |
| 30.09.2010 | 383 563.00 | 395 956.00 | -12 393.00 | -3.13% | 348 108.00 | 35 455.00 | 10.19% |
| 30.06.2010 | 395 956.00 | 350 775.00 | 45 181.00 | 12.88% | 341 164.00 | 54 792.00 | 16.06% |
| 31.03.2010 | 350 775.00 | 349 688.00 | 1 087.00 | 0.31% | 347 240.00 | 3 535.00 | 1.02% |
| 31.12.2009 | 349 688.00 | 348 108.00 | 1 580.00 | 0.45% | 385 032.00 | -35 344.00 | -9.18% |
| 30.09.2009 | 348 108.00 | 341 164.00 | 6 944.00 | 2.04% | 382 474.00 | -34 366.00 | -8.99% |
| 30.06.2009 | 341 164.00 | 347 240.00 | -6 076.00 | -1.75% | 372 206.00 | -31 042.00 | -8.34% |
| 31.03.2009 | 347 240.00 | 385 032.00 | -37 792.00 | -9.82% | 381 033.00 | -33 793.00 | -8.87% |
| 31.12.2008 | 385 032.00 | 382 474.00 | 2 558.00 | 0.67% | - | - | - |
| 30.09.2008 | 382 474.00 | 372 206.00 | 10 268.00 | 2.76% | - | - | - |
| 30.06.2008 | 372 206.00 | 381 033.00 | -8 827.00 | -2.32% | - | - | - |
| 31.03.2008 | 381 033.00 | - | - | - | - | - | - |
Graf jako obrázek

Podobné sestavy
Aplikace Ekonomika ČNB ze sekce makroekonomika zobrazuje časové řady hlavních makroekonomických údajů z ekonomiky ČR. Najdete zde přes 10.000 grafů různých hodnot od úrokových sazeb, přes statistiky státního rozpočtu, statistiky ČNB a data zpracovávaná ČSÚ. Data jsou k dispozici obvykle za posledních více než 20 let, od prosince roku 1992. Zdroj dat: ČNB ARAD

