Securities other than shares (Bond funds balance sheet - flows) - ekonomika ČNB
Aktualizace dat Securities other than shares (Bond funds balance sheet - flows) v této aplikaci skončila 30.6.2023. Aktualizovná data časových řad najdete na stránkách nové aplikace z dat ARAD ČNB
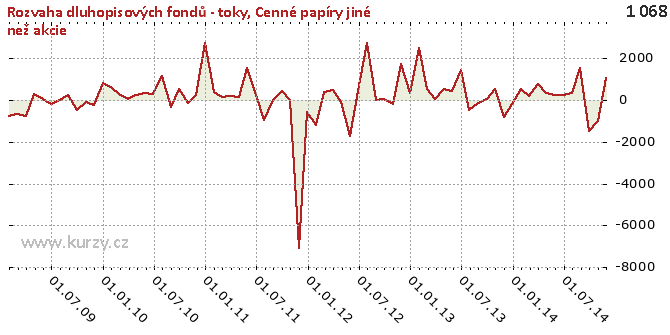
Graf hodnot, Bond funds balance sheet - flows
Meziroční srovnání
Minima a maxima
| Typ | Období | Hodnota |
|---|---|---|
| Max | 31.07.2012 | 2 753.28 |
| Min | 30.11.2011 | -7 110.83 |
Historické hodnoty
| Období | Hodnota | Předchozí | Rozdíl | Změna | Před rokem | Rozdíl | Změna |
|---|---|---|---|---|---|---|---|
| 30.11.2014 | 1 068.99 | - 995.14 | 2 064.13 | - 207.42% | - 813.47 | 1 882.45 | - 231.41% |
| 31.10.2014 | - 995.14 | -1 465.99 | 470.85 | -32.12% | 522.23 | -1 517.37 | - 290.56% |
| 30.09.2014 | -1 465.99 | 1 516.97 | -2 982.96 | - 196.64% | 47.05 | -1 513.04 | -3 215.81% |
| 31.08.2014 | 1 516.97 | 343.98 | 1 172.99 | 341.00% | - 154.56 | 1 671.54 | -1 081.45% |
| 31.07.2014 | 343.98 | 236.69 | 107.29 | 45.33% | - 491.93 | 835.91 | - 169.93% |
| 30.06.2014 | 236.69 | 239.71 | -3.01 | -1.26% | 1 430.22 | -1 193.52 | -83.45% |
| 31.05.2014 | 239.71 | 315.07 | -75.36 | -23.92% | 414.77 | - 175.06 | -42.21% |
| 30.04.2014 | 315.07 | 781.98 | - 466.91 | -59.71% | 508.67 | - 193.60 | -38.06% |
| 31.03.2014 | 781.98 | 190.35 | 591.63 | 310.81% | 73.11 | 708.88 | 969.67% |
| 28.02.2014 | 190.35 | 529.93 | - 339.57 | -64.08% | 510.96 | - 320.61 | -62.75% |
| 31.01.2014 | 529.93 | - 207.53 | 737.46 | - 355.35% | 2 476.42 | -1 946.49 | -78.60% |
| 31.12.2013 | - 207.53 | - 813.47 | 605.94 | -74.49% | 343.50 | - 551.03 | - 160.42% |
| 30.11.2013 | - 813.47 | 522.23 | -1 335.69 | - 255.77% | 1 720.76 | -2 534.23 | - 147.27% |
| 31.10.2013 | 522.23 | 47.05 | 475.18 | 1 009.94% | - 196.77 | 719.00 | - 365.40% |
| 30.09.2013 | 47.05 | - 154.56 | 201.61 | - 130.44% | 60.41 | -13.36 | -22.11% |
| 31.08.2013 | - 154.56 | - 491.93 | 337.37 | -68.58% | -21.44 | - 133.12 | 620.91% |
| 31.07.2013 | - 491.93 | 1 430.22 | -1 922.15 | - 134.40% | 2 753.28 | -3 245.21 | - 117.87% |
| 30.06.2013 | 1 430.22 | 414.77 | 1 015.45 | 244.82% | 438.21 | 992.01 | 226.38% |
| 31.05.2013 | 414.77 | 508.67 | -93.90 | -18.46% | -1 703.46 | 2 118.23 | - 124.35% |
| 30.04.2013 | 508.67 | 73.11 | 435.57 | 595.81% | - 103.93 | 612.60 | - 589.45% |
| 31.03.2013 | 73.11 | 510.96 | - 437.85 | -85.69% | 481.57 | - 408.46 | -84.82% |
| 28.02.2013 | 510.96 | 2 476.42 | -1 965.46 | -79.37% | 391.36 | 119.60 | 30.56% |
| 31.01.2013 | 2 476.42 | 343.50 | 2 132.92 | 620.93% | -1 203.98 | 3 680.41 | - 305.69% |
| 31.12.2012 | 343.50 | 1 720.76 | -1 377.26 | -80.04% | - 583.78 | 927.28 | - 158.84% |
| 30.11.2012 | 1 720.76 | - 196.77 | 1 917.53 | - 974.50% | -7 110.83 | 8 831.59 | - 124.20% |
| 31.10.2012 | - 196.77 | 60.41 | - 257.18 | - 425.75% | 11.46 | - 208.23 | -1 817.17% |
| 30.09.2012 | 60.41 | -21.44 | 81.84 | - 381.74% | 450.06 | - 389.66 | -86.58% |
| 31.08.2012 | -21.44 | 2 753.28 | -2 774.72 | - 100.78% | 17.42 | -38.86 | - 223.08% |
| 31.07.2012 | 2 753.28 | 438.21 | 2 315.07 | 528.31% | - 965.56 | 3 718.84 | - 385.15% |
| 30.06.2012 | 438.21 | -1 703.46 | 2 141.66 | - 125.72% | 237.72 | 200.49 | 84.34% |
| 31.05.2012 | -1 703.46 | - 103.93 | -1 599.53 | 1 539.11% | 1 512.82 | -3 216.28 | - 212.60% |
| 30.04.2012 | - 103.93 | 481.57 | - 585.49 | - 121.58% | 154.39 | - 258.31 | - 167.32% |
| 31.03.2012 | 481.57 | 391.36 | 90.21 | 23.05% | 170.45 | 311.12 | 182.53% |
| 29.02.2012 | 391.36 | -1 203.98 | 1 595.35 | - 132.51% | 148.70 | 242.66 | 163.19% |
| 31.01.2012 | -1 203.98 | - 583.78 | - 620.21 | 106.24% | 403.85 | -1 607.83 | - 398.13% |
| 31.12.2011 | - 583.78 | -7 110.83 | 6 527.06 | -91.79% | 2 742.74 | -3 326.52 | - 121.28% |
| 30.11.2011 | -7 110.83 | 11.46 | -7 122.29 | -62 154.55% | 246.50 | -7 357.34 | -2 984.66% |
| 31.10.2011 | 11.46 | 450.06 | - 438.60 | -97.45% | - 127.39 | 138.85 | - 109.00% |
| 30.09.2011 | 450.06 | 17.42 | 432.64 | 2 483.74% | 508.75 | -58.69 | -11.54% |
| 31.08.2011 | 17.42 | - 965.56 | 982.98 | - 101.80% | - 319.51 | 336.93 | - 105.45% |
| 31.07.2011 | - 965.56 | 237.72 | -1 203.28 | - 506.18% | 1 128.86 | -2 094.42 | - 185.53% |
| 30.06.2011 | 237.72 | 1 512.82 | -1 275.10 | -84.29% | 281.26 | -43.54 | -15.48% |
| 31.05.2011 | 1 512.82 | 154.39 | 1 358.43 | 879.89% | 354.07 | 1 158.75 | 327.26% |
| 30.04.2011 | 154.39 | 170.45 | -16.06 | -9.42% | 260.72 | - 106.33 | -40.78% |
| 31.03.2011 | 170.45 | 148.70 | 21.75 | 14.63% | 55.21 | 115.24 | 208.74% |
| 28.02.2011 | 148.70 | 403.85 | - 255.15 | -63.18% | 310.18 | - 161.48 | -52.06% |
| 31.01.2011 | 403.85 | 2 742.74 | -2 338.89 | -85.28% | 607.34 | - 203.49 | -33.51% |
| 31.12.2010 | 2 742.74 | 246.50 | 2 496.24 | 1 012.65% | 806.06 | 1 936.68 | 240.26% |
| 30.11.2010 | 246.50 | - 127.39 | 373.90 | - 293.50% | - 232.68 | 479.18 | - 205.94% |
| 31.10.2010 | - 127.39 | 508.75 | - 636.14 | - 125.04% | -90.68 | -36.71 | 40.49% |
| 30.09.2010 | 508.75 | - 319.51 | 828.26 | - 259.23% | - 457.79 | 966.54 | - 211.13% |
| 31.08.2010 | - 319.51 | 1 128.86 | -1 448.37 | - 128.30% | 244.58 | - 564.09 | - 230.63% |
| 31.07.2010 | 1 128.86 | 281.26 | 847.61 | 301.36% | 25.22 | 1 103.64 | 4 376.24% |
| 30.06.2010 | 281.26 | 354.07 | -72.81 | -20.56% | - 204.40 | 485.66 | - 237.60% |
| 31.05.2010 | 354.07 | 260.72 | 93.35 | 35.81% | 28.55 | 325.52 | 1 140.23% |
| 30.04.2010 | 260.72 | 55.21 | 205.51 | 372.25% | 277.83 | -17.11 | -6.16% |
| 31.03.2010 | 55.21 | 310.18 | - 254.97 | -82.20% | - 749.74 | 804.95 | - 107.36% |
| 28.02.2010 | 310.18 | 607.34 | - 297.17 | -48.93% | - 683.04 | 993.22 | - 145.41% |
| 31.01.2010 | 607.34 | 806.06 | - 198.72 | -24.65% | - 779.92 | 1 387.26 | - 177.87% |
| 31.12.2009 | 806.06 | - 232.68 | 1 038.74 | - 446.43% | - | - | - |
| 30.11.2009 | - 232.68 | -90.68 | - 142.00 | 156.59% | - | - | - |
| 31.10.2009 | -90.68 | - 457.79 | 367.11 | -80.19% | - | - | - |
| 30.09.2009 | - 457.79 | 244.58 | - 702.37 | - 287.17% | - | - | - |
| 31.08.2009 | 244.58 | 25.22 | 219.36 | 869.83% | - | - | - |
| 31.07.2009 | 25.22 | - 204.40 | 229.62 | - 112.34% | - | - | - |
| 30.06.2009 | - 204.40 | 28.55 | - 232.95 | - 815.95% | - | - | - |
| 31.05.2009 | 28.55 | 277.83 | - 249.28 | -89.72% | - | - | - |
| 30.04.2009 | 277.83 | - 749.74 | 1 027.57 | - 137.06% | - | - | - |
| 31.03.2009 | - 749.74 | - 683.04 | -66.70 | 9.76% | - | - | - |
| 28.02.2009 | - 683.04 | - 779.92 | 96.87 | -12.42% | - | - | - |
| 31.01.2009 | - 779.92 | - | - | - | - | - | - |
Graf jako obrázek

Podobné sestavy
Aplikace Ekonomika ČNB ze sekce makroekonomika zobrazuje časové řady hlavních makroekonomických údajů z ekonomiky ČR. Najdete zde přes 10.000 grafů různých hodnot od úrokových sazeb, přes statistiky státního rozpočtu, statistiky ČNB a data zpracovávaná ČSÚ. Data jsou k dispozici obvykle za posledních více než 20 let, od prosince roku 1992. Zdroj dat: ČNB ARAD

