Equity, total (Liabilities and equity»Building societies) - ekonomika ČNB
Aktualizace dat Equity, total (Liabilities and equity»Building societies) v této aplikaci skončila 30.6.2023. Aktualizovná data časových řad najdete na stránkách nové aplikace z dat ARAD ČNB
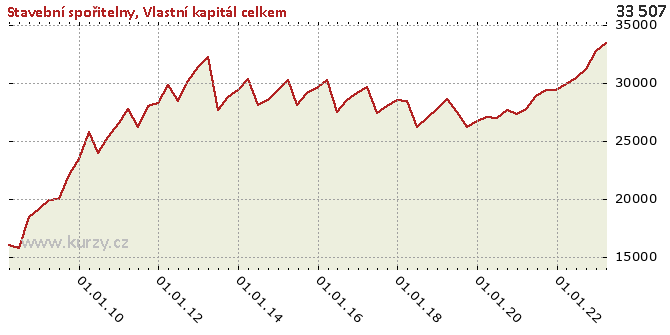
Graf hodnot, Building societies
Meziroční srovnání
Minima a maxima
| Typ | Období | Hodnota |
|---|---|---|
| Max | 31.03.2013 | 32 254.00 |
| Min | 30.06.2008 | 15 717.00 |
Historické hodnoty
| Období | Hodnota | Předchozí | Rozdíl | Změna | Před rokem | Rozdíl | Změna |
|---|---|---|---|---|---|---|---|
| 31.03.2020 | 27 078.00 | 26 735.00 | 343.00 | 1.28% | 28 604.00 | -1 526.00 | -5.33% |
| 31.12.2019 | 26 735.00 | 26 220.00 | 515.00 | 1.96% | 27 778.00 | -1 043.00 | -3.75% |
| 30.09.2019 | 26 220.00 | 27 545.00 | -1 325.00 | -4.81% | 26 962.00 | - 742.00 | -2.75% |
| 30.06.2019 | 27 545.00 | 28 604.00 | -1 059.00 | -3.70% | 26 231.00 | 1 314.00 | 5.01% |
| 31.03.2019 | 28 604.00 | 27 778.00 | 826.00 | 2.97% | 28 433.00 | 171.00 | 0.60% |
| 31.12.2018 | 27 778.00 | 26 962.00 | 816.00 | 3.03% | 28 574.00 | - 796.00 | -2.79% |
| 30.09.2018 | 26 962.00 | 26 231.00 | 731.00 | 2.79% | 28 069.00 | -1 107.00 | -3.94% |
| 30.06.2018 | 26 231.00 | 28 433.00 | -2 202.00 | -7.74% | 27 460.00 | -1 229.00 | -4.48% |
| 31.03.2018 | 28 433.00 | 28 574.00 | - 141.00 | -0.49% | 29 643.00 | -1 210.00 | -4.08% |
| 31.12.2017 | 28 574.00 | 28 069.00 | 505.00 | 1.80% | 29 149.00 | - 575.00 | -1.97% |
| 30.09.2017 | 28 069.00 | 27 460.00 | 609.00 | 2.22% | 28 510.00 | - 441.00 | -1.55% |
| 30.06.2017 | 27 460.00 | 29 643.00 | -2 183.00 | -7.36% | 27 468.00 | -8.00 | -0.03% |
| 31.03.2017 | 29 643.00 | 29 149.00 | 494.00 | 1.69% | 30 255.00 | - 612.00 | -2.02% |
| 31.12.2016 | 29 149.00 | 28 510.00 | 639.00 | 2.24% | 29 629.00 | - 480.00 | -1.62% |
| 30.09.2016 | 28 510.00 | 27 468.00 | 1 042.00 | 3.79% | 29 148.00 | - 638.00 | -2.19% |
| 30.06.2016 | 27 468.00 | 30 255.00 | -2 787.00 | -9.21% | 28 122.00 | - 654.00 | -2.33% |
| 31.03.2016 | 30 255.00 | 29 629.00 | 626.00 | 2.11% | 30 244.00 | 11.00 | 0.04% |
| 31.12.2015 | 29 629.00 | 29 148.00 | 481.00 | 1.65% | 29 436.00 | 193.00 | 0.66% |
| 30.09.2015 | 29 148.00 | 28 122.00 | 1 026.00 | 3.65% | 28 561.00 | 587.00 | 2.06% |
| 30.06.2015 | 28 122.00 | 30 244.00 | -2 122.00 | -7.02% | 28 122.00 | 0.00 | 0.00 |
| 31.03.2015 | 30 244.00 | 29 436.00 | 808.00 | 2.74% | 30 344.00 | - 100.00 | -0.33% |
| 31.12.2014 | 29 436.00 | 28 561.00 | 875.00 | 3.06% | 29 383.00 | 53.00 | 0.18% |
| 30.09.2014 | 28 561.00 | 28 122.00 | 439.00 | 1.56% | 28 789.00 | - 228.00 | -0.79% |
| 30.06.2014 | 28 122.00 | 30 344.00 | -2 222.00 | -7.32% | 27 672.00 | 450.00 | 1.63% |
| 31.03.2014 | 30 344.00 | 29 383.00 | 961.00 | 3.27% | 32 254.00 | -1 910.00 | -5.92% |
| 31.12.2013 | 29 383.00 | 28 789.00 | 594.00 | 2.06% | 31 421.00 | -2 038.00 | -6.49% |
| 30.09.2013 | 28 789.00 | 27 672.00 | 1 117.00 | 4.04% | 30 197.00 | -1 408.00 | -4.66% |
| 30.06.2013 | 27 672.00 | 32 254.00 | -4 582.00 | -14.21% | 28 432.00 | - 760.00 | -2.67% |
| 31.03.2013 | 32 254.00 | 31 421.00 | 833.00 | 2.65% | 29 803.00 | 2 451.00 | 8.22% |
| 31.12.2012 | 31 421.00 | 30 197.00 | 1 224.00 | 4.05% | 28 317.00 | 3 104.00 | 10.96% |
| 30.09.2012 | 30 197.00 | 28 432.00 | 1 765.00 | 6.21% | 28 063.00 | 2 134.00 | 7.60% |
| 30.06.2012 | 28 432.00 | 29 803.00 | -1 371.00 | -4.60% | 26 254.00 | 2 178.00 | 8.30% |
| 31.03.2012 | 29 803.00 | 28 317.00 | 1 486.00 | 5.25% | 27 805.00 | 1 998.00 | 7.19% |
| 31.12.2011 | 28 317.00 | 28 063.00 | 254.00 | 0.91% | 26 593.00 | 1 724.00 | 6.48% |
| 30.09.2011 | 28 063.00 | 26 254.00 | 1 809.00 | 6.89% | 25 323.00 | 2 740.00 | 10.82% |
| 30.06.2011 | 26 254.00 | 27 805.00 | -1 551.00 | -5.58% | 23 961.00 | 2 293.00 | 9.57% |
| 31.03.2011 | 27 805.00 | 26 593.00 | 1 212.00 | 4.56% | 25 745.00 | 2 060.00 | 8.00% |
| 31.12.2010 | 26 593.00 | 25 323.00 | 1 270.00 | 5.02% | 23 449.00 | 3 144.00 | 13.41% |
| 30.09.2010 | 25 323.00 | 23 961.00 | 1 362.00 | 5.68% | 22 081.00 | 3 242.00 | 14.68% |
| 30.06.2010 | 23 961.00 | 25 745.00 | -1 784.00 | -6.93% | 19 949.00 | 4 012.00 | 20.11% |
| 31.03.2010 | 25 745.00 | 23 449.00 | 2 296.00 | 9.79% | 19 943.00 | 5 802.00 | 29.09% |
| 31.12.2009 | 23 449.00 | 22 081.00 | 1 368.00 | 6.20% | 19 138.00 | 4 311.00 | 22.53% |
| 30.09.2009 | 22 081.00 | 19 949.00 | 2 132.00 | 10.69% | 18 409.00 | 3 672.00 | 19.95% |
| 30.06.2009 | 19 949.00 | 19 943.00 | 6.00 | 0.03% | 15 717.00 | 4 232.00 | 26.93% |
| 31.03.2009 | 19 943.00 | 19 138.00 | 805.00 | 4.21% | 16 033.00 | 3 910.00 | 24.39% |
| 31.12.2008 | 19 138.00 | 18 409.00 | 729.00 | 3.96% | - | - | - |
| 30.09.2008 | 18 409.00 | 15 717.00 | 2 692.00 | 17.13% | - | - | - |
| 30.06.2008 | 15 717.00 | 16 033.00 | - 316.00 | -1.97% | - | - | - |
| 31.03.2008 | 16 033.00 | - | - | - | - | - | - |
Graf jako obrázek

Podobné sestavy
Aplikace Ekonomika ČNB ze sekce makroekonomika zobrazuje časové řady hlavních makroekonomických údajů z ekonomiky ČR. Najdete zde přes 10.000 grafů různých hodnot od úrokových sazeb, přes statistiky státního rozpočtu, statistiky ČNB a data zpracovávaná ČSÚ. Data jsou k dispozici obvykle za posledních více než 20 let, od prosince roku 1992. Zdroj dat: ČNB ARAD
Příbuzné stránky
- Save and Gain - aktuální a historické ceny kryptoměny Save and Gain, graf vývoje ceny kryptoměny Save and Gain - 2 dny - měna USD
- Sport and Leisure - aktuální a historické ceny kryptoměny Sport and Leisure, graf vývoje ceny kryptoměny Sport and Leisure - 3 dny - měna USD
- Sport and Leisure - aktuální a historické ceny kryptoměny Sport and Leisure, graf vývoje ceny kryptoměny Sport and Leisure - 1 rok - měna EUR
- Sport and Leisure - aktuální a historické ceny kryptoměny Sport and Leisure, graf vývoje ceny kryptoměny Sport and Leisure - 2 roky - měna CZK
- Sport and Leisure - aktuální a historické ceny kryptoměny Sport and Leisure, graf vývoje ceny kryptoměny Sport and Leisure - 5 dnů - měna EUR
- Sport and Leisure - aktuální a historické ceny kryptoměny Sport and Leisure, graf vývoje ceny kryptoměny Sport and Leisure - 2 dny - měna CZK
- Sport and Leisure - aktuální a historické ceny kryptoměny Sport and Leisure, graf vývoje ceny kryptoměny Sport and Leisure - 1 den - měna USD
- Save and Gain - aktuální a historické ceny kryptoměny Save and Gain, graf vývoje ceny kryptoměny Save and Gain - 3 měsíce - měna USD
- Save and Gain - aktuální a historické ceny kryptoměny Save and Gain, graf vývoje ceny kryptoměny Save and Gain - 1 den - měna USD
- Sport and Leisure - aktuální a historické ceny kryptoměny Sport and Leisure, graf vývoje ceny kryptoměny Sport and Leisure - 3 roky - měna EUR
- Sport and Leisure - aktuální a historické ceny kryptoměny Sport and Leisure, graf vývoje ceny kryptoměny Sport and Leisure - 1 rok - měna CZK
- Sport and Leisure - aktuální a historické ceny kryptoměny Sport and Leisure, graf vývoje ceny kryptoměny Sport and Leisure - 2 dny - měna USD

