All issuers (Debt securities - holdings by all residents) - ekonomika ČNB
Aktualizace dat All issuers (Debt securities - holdings by all residents) v této aplikaci skončila 30.6.2023. Aktualizovná data časových řad najdete na stránkách nové aplikace z dat ARAD ČNB
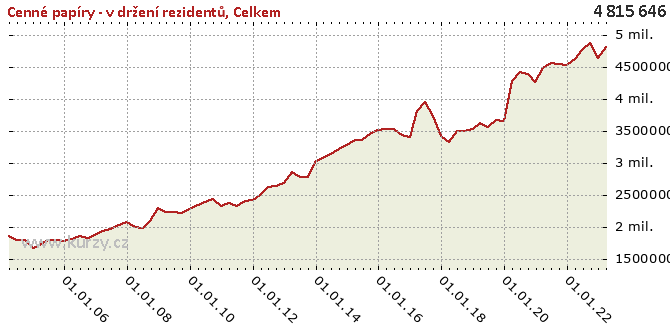
Graf hodnot, Debt securities - holdings by all residents
Meziroční srovnání
Minima a maxima
| Typ | Období | Hodnota |
|---|---|---|
| Max | 31.03.2020 | 4 281 505.00 |
| Min | 31.12.2004 | 1 658 565.00 |
Historické hodnoty
| Období | Hodnota | Předchozí | Rozdíl | Změna | Před rokem | Rozdíl | Změna |
|---|---|---|---|---|---|---|---|
| 31.03.2020 | 4 281 505.00 | 3 649 612.00 | 631 893.00 | 17.31% | 3 618 640.00 | 662 865.00 | 18.32% |
| 31.12.2019 | 3 649 612.00 | 3 669 241.00 | -19 629.00 | -0.53% | 3 528 656.00 | 120 956.00 | 3.43% |
| 30.09.2019 | 3 669 241.00 | 3 566 580.00 | 102 661.00 | 2.88% | 3 506 235.00 | 163 006.00 | 4.65% |
| 30.06.2019 | 3 566 580.00 | 3 618 640.00 | -52 060.00 | -1.44% | 3 501 326.00 | 65 254.00 | 1.86% |
| 31.03.2019 | 3 618 640.00 | 3 528 656.00 | 89 984.00 | 2.55% | 3 327 014.00 | 291 626.00 | 8.77% |
| 31.12.2018 | 3 528 656.00 | 3 506 235.00 | 22 421.00 | 0.64% | 3 424 017.00 | 104 639.00 | 3.06% |
| 30.09.2018 | 3 506 235.00 | 3 501 326.00 | 4 909.00 | 0.14% | 3 742 424.00 | - 236 189.00 | -6.31% |
| 30.06.2018 | 3 501 326.00 | 3 327 014.00 | 174 312.00 | 5.24% | 3 949 269.00 | - 447 943.00 | -11.34% |
| 31.03.2018 | 3 327 014.00 | 3 424 017.00 | -97 003.00 | -2.83% | 3 819 260.00 | - 492 246.00 | -12.89% |
| 31.12.2017 | 3 424 017.00 | 3 742 424.00 | - 318 407.00 | -8.51% | 3 400 712.00 | 23 305.00 | 0.69% |
| 30.09.2017 | 3 742 424.00 | 3 949 269.00 | - 206 845.00 | -5.24% | 3 440 272.00 | 302 152.00 | 8.78% |
| 30.06.2017 | 3 949 269.00 | 3 819 260.00 | 130 009.00 | 3.40% | 3 533 683.00 | 415 586.00 | 11.76% |
| 31.03.2017 | 3 819 260.00 | 3 400 712.00 | 418 548.00 | 12.31% | 3 533 007.00 | 286 253.00 | 8.10% |
| 31.12.2016 | 3 400 712.00 | 3 440 272.00 | -39 560.00 | -1.15% | 3 511 226.00 | - 110 514.00 | -3.15% |
| 30.09.2016 | 3 440 272.00 | 3 533 683.00 | -93 411.00 | -2.64% | 3 458 388.00 | -18 116.00 | -0.52% |
| 30.06.2016 | 3 533 683.00 | 3 533 007.00 | 676.00 | 0.02% | 3 352 153.00 | 181 530.00 | 5.42% |
| 31.03.2016 | 3 533 007.00 | 3 511 226.00 | 21 781.00 | 0.62% | 3 357 037.00 | 175 970.00 | 5.24% |
| 31.12.2015 | 3 511 226.00 | 3 458 388.00 | 52 838.00 | 1.53% | 3 275 365.00 | 235 861.00 | 7.20% |
| 30.09.2015 | 3 458 388.00 | 3 352 153.00 | 106 235.00 | 3.17% | 3 223 393.00 | 234 995.00 | 7.29% |
| 30.06.2015 | 3 352 153.00 | 3 357 037.00 | -4 884.00 | -0.15% | 3 139 856.00 | 212 297.00 | 6.76% |
| 31.03.2015 | 3 357 037.00 | 3 275 365.00 | 81 672.00 | 2.49% | 3 074 075.00 | 282 962.00 | 9.20% |
| 31.12.2014 | 3 275 365.00 | 3 223 393.00 | 51 972.00 | 1.61% | 3 017 002.00 | 258 363.00 | 8.56% |
| 30.09.2014 | 3 223 393.00 | 3 139 856.00 | 83 537.00 | 2.66% | 2 773 270.00 | 450 123.00 | 16.23% |
| 30.06.2014 | 3 139 856.00 | 3 074 075.00 | 65 781.00 | 2.14% | 2 773 906.00 | 365 950.00 | 13.19% |
| 31.03.2014 | 3 074 075.00 | 3 017 002.00 | 57 073.00 | 1.89% | 2 850 153.00 | 223 922.00 | 7.86% |
| 31.12.2013 | 3 017 002.00 | 2 773 270.00 | 243 732.00 | 8.79% | 2 682 208.00 | 334 794.00 | 12.48% |
| 30.09.2013 | 2 773 270.00 | 2 773 906.00 | - 636.00 | -0.02% | 2 638 989.00 | 134 281.00 | 5.09% |
| 30.06.2013 | 2 773 906.00 | 2 850 153.00 | -76 247.00 | -2.68% | 2 627 087.00 | 146 819.00 | 5.59% |
| 31.03.2013 | 2 850 153.00 | 2 682 208.00 | 167 945.00 | 6.26% | 2 500 454.00 | 349 699.00 | 13.99% |
| 31.12.2012 | 2 682 208.00 | 2 638 989.00 | 43 219.00 | 1.64% | 2 416 655.00 | 265 553.00 | 10.99% |
| 30.09.2012 | 2 638 989.00 | 2 627 087.00 | 11 902.00 | 0.45% | 2 398 156.00 | 240 833.00 | 10.04% |
| 30.06.2012 | 2 627 087.00 | 2 500 454.00 | 126 633.00 | 5.06% | 2 320 200.00 | 306 887.00 | 13.23% |
| 31.03.2012 | 2 500 454.00 | 2 416 655.00 | 83 799.00 | 3.47% | 2 374 338.00 | 126 116.00 | 5.31% |
| 31.12.2011 | 2 416 655.00 | 2 398 156.00 | 18 499.00 | 0.77% | 2 317 757.00 | 98 898.00 | 4.27% |
| 30.09.2011 | 2 398 156.00 | 2 320 200.00 | 77 956.00 | 3.36% | 2 427 815.00 | -29 659.00 | -1.22% |
| 30.06.2011 | 2 320 200.00 | 2 374 338.00 | -54 138.00 | -2.28% | 2 378 963.00 | -58 763.00 | -2.47% |
| 31.03.2011 | 2 374 338.00 | 2 317 757.00 | 56 581.00 | 2.44% | 2 337 298.00 | 37 040.00 | 1.58% |
| 31.12.2010 | 2 317 757.00 | 2 427 815.00 | - 110 058.00 | -4.53% | 2 279 017.00 | 38 740.00 | 1.70% |
| 30.09.2010 | 2 427 815.00 | 2 378 963.00 | 48 852.00 | 2.05% | 2 211 218.00 | 216 597.00 | 9.80% |
| 30.06.2010 | 2 378 963.00 | 2 337 298.00 | 41 665.00 | 1.78% | 2 224 495.00 | 154 468.00 | 6.94% |
| 31.03.2010 | 2 337 298.00 | 2 279 017.00 | 58 281.00 | 2.56% | 2 224 852.00 | 112 446.00 | 5.05% |
| 31.12.2009 | 2 279 017.00 | 2 211 218.00 | 67 799.00 | 3.07% | 2 286 397.00 | -7 380.00 | -0.32% |
| 30.09.2009 | 2 211 218.00 | 2 224 495.00 | -13 277.00 | -0.60% | 2 086 872.00 | 124 346.00 | 5.96% |
| 30.06.2009 | 2 224 495.00 | 2 224 852.00 | - 357.00 | -0.02% | 1 978 227.00 | 246 268.00 | 12.45% |
| 31.03.2009 | 2 224 852.00 | 2 286 397.00 | -61 545.00 | -2.69% | 1 986 714.00 | 238 138.00 | 11.99% |
| 31.12.2008 | 2 286 397.00 | 2 086 872.00 | 199 525.00 | 9.56% | 2 070 456.00 | 215 941.00 | 10.43% |
| 30.09.2008 | 2 086 872.00 | 1 978 227.00 | 108 645.00 | 5.49% | 2 022 383.00 | 64 489.00 | 3.19% |
| 30.06.2008 | 1 978 227.00 | 1 986 714.00 | -8 487.00 | -0.43% | 1 957 185.00 | 21 042.00 | 1.08% |
| 31.03.2008 | 1 986 714.00 | 2 070 456.00 | -83 742.00 | -4.04% | 1 933 135.00 | 53 579.00 | 2.77% |
| 31.12.2007 | 2 070 456.00 | 2 022 383.00 | 48 073.00 | 2.38% | 1 861 240.00 | 209 216.00 | 11.24% |
| 30.09.2007 | 2 022 383.00 | 1 957 185.00 | 65 198.00 | 3.33% | 1 823 397.00 | 198 986.00 | 10.91% |
| 30.06.2007 | 1 957 185.00 | 1 933 135.00 | 24 050.00 | 1.24% | 1 850 718.00 | 106 467.00 | 5.75% |
| 31.03.2007 | 1 933 135.00 | 1 861 240.00 | 71 895.00 | 3.86% | 1 806 934.00 | 126 201.00 | 6.98% |
| 31.12.2006 | 1 861 240.00 | 1 823 397.00 | 37 843.00 | 2.08% | 1 770 291.00 | 90 949.00 | 5.14% |
| 30.09.2006 | 1 823 397.00 | 1 850 718.00 | -27 321.00 | -1.48% | 1 793 032.00 | 30 365.00 | 1.69% |
| 30.06.2006 | 1 850 718.00 | 1 806 934.00 | 43 784.00 | 2.42% | 1 792 929.00 | 57 789.00 | 3.22% |
| 31.03.2006 | 1 806 934.00 | 1 770 291.00 | 36 643.00 | 2.07% | 1 709 004.00 | 97 930.00 | 5.73% |
| 31.12.2005 | 1 770 291.00 | 1 793 032.00 | -22 741.00 | -1.27% | 1 658 565.00 | 111 726.00 | 6.74% |
| 30.09.2005 | 1 793 032.00 | 1 792 929.00 | 103.00 | 0.01% | 1 791 653.00 | 1 379.00 | 0.08% |
| 30.06.2005 | 1 792 929.00 | 1 709 004.00 | 83 925.00 | 4.91% | 1 791 209.00 | 1 720.00 | 0.10% |
| 31.03.2005 | 1 709 004.00 | 1 658 565.00 | 50 439.00 | 3.04% | 1 853 658.00 | - 144 654.00 | -7.80% |
| 31.12.2004 | 1 658 565.00 | 1 791 653.00 | - 133 088.00 | -7.43% | - | - | - |
| 30.09.2004 | 1 791 653.00 | 1 791 209.00 | 444.00 | 0.02% | - | - | - |
| 30.06.2004 | 1 791 209.00 | 1 853 658.00 | -62 449.00 | -3.37% | - | - | - |
| 31.03.2004 | 1 853 658.00 | - | - | - | - | - | - |
Graf jako obrázek

Podobné sestavy
Aplikace Ekonomika ČNB ze sekce makroekonomika zobrazuje časové řady hlavních makroekonomických údajů z ekonomiky ČR. Najdete zde přes 10.000 grafů různých hodnot od úrokových sazeb, přes statistiky státního rozpočtu, statistiky ČNB a data zpracovávaná ČSÚ. Data jsou k dispozici obvykle za posledních více než 20 let, od prosince roku 1992. Zdroj dat: ČNB ARAD

