Securities other than shares (Equity funds balance sheet) - ekonomika ČNB
Aktualizace dat Securities other than shares (Equity funds balance sheet) v této aplikaci skončila 30.6.2023. Aktualizovná data časových řad najdete na stránkách nové aplikace z dat ARAD ČNB
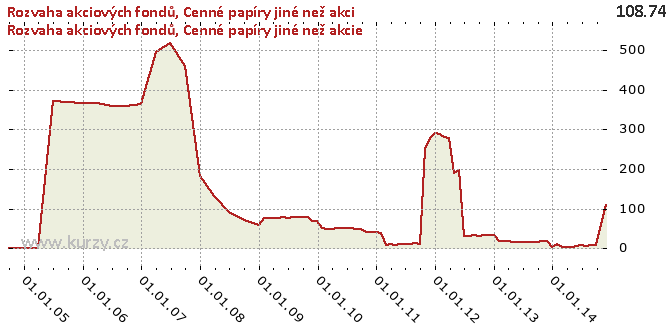
Graf hodnot, Equity funds balance sheet
Meziroční srovnání
Minima a maxima
| Typ | Období | Hodnota |
|---|---|---|
| Min | 31.12.2013 | 3.68 |
| Max | 30.06.2007 | 518.12 |
Historické hodnoty
| Období | Hodnota | Předchozí | Rozdíl | Změna | Před rokem | Rozdíl | Změna |
|---|---|---|---|---|---|---|---|
| 30.11.2014 | 108.75 | 60.40 | 48.35 | 80.04% | 18.55 | 90.19 | 486.11% |
| 31.10.2014 | 60.40 | 8.89 | 51.51 | 579.41% | 18.81 | 41.59 | 221.17% |
| 30.09.2014 | 8.89 | 9.42 | -0.53 | -5.60% | 16.98 | -8.09 | -47.65% |
| 31.08.2014 | 9.42 | 7.24 | 2.17 | 30.00% | 16.91 | -7.49 | -44.31% |
| 31.07.2014 | 7.24 | 7.91 | -0.67 | -8.43% | 17.41 | -10.16 | -58.39% |
| 30.06.2014 | 7.91 | 6.79 | 1.12 | 16.48% | 15.06 | -7.15 | -47.49% |
| 31.05.2014 | 6.79 | 4.55 | 2.25 | 49.41% | 17.05 | -10.26 | -60.17% |
| 30.04.2014 | 4.55 | 4.40 | 0.15 | 3.32% | 17.13 | -12.58 | -73.46% |
| 31.03.2014 | 4.40 | 4.43 | -0.03 | -0.77% | 18.41 | -14.01 | -76.10% |
| 28.02.2014 | 4.43 | 10.47 | -6.04 | -57.66% | 18.06 | -13.62 | -75.44% |
| 31.01.2014 | 10.47 | 3.68 | 6.79 | 184.59% | 19.34 | -8.87 | -45.85% |
| 31.12.2013 | 3.68 | 18.55 | -14.87 | -80.17% | 33.88 | -30.20 | -89.14% |
| 30.11.2013 | 18.55 | 18.81 | -0.25 | -1.34% | 33.94 | -15.39 | -45.33% |
| 31.10.2013 | 18.81 | 16.98 | 1.82 | 10.74% | 33.71 | -14.90 | -44.21% |
| 30.09.2013 | 16.98 | 16.91 | 0.07 | 0.42% | 31.41 | -14.43 | -45.94% |
| 31.08.2013 | 16.91 | 17.41 | -0.50 | -2.86% | 33.49 | -16.58 | -49.51% |
| 31.07.2013 | 17.41 | 15.06 | 2.34 | 15.56% | 32.13 | -14.73 | -45.83% |
| 30.06.2013 | 15.06 | 17.05 | -1.99 | -11.66% | 31.43 | -16.36 | -52.06% |
| 31.05.2013 | 17.05 | 17.13 | -0.08 | -0.44% | 197.02 | - 179.96 | -91.34% |
| 30.04.2013 | 17.13 | 18.41 | -1.28 | -6.97% | 190.40 | - 173.27 | -91.00% |
| 31.03.2013 | 18.41 | 18.06 | 0.35 | 1.97% | 278.16 | - 259.75 | -93.38% |
| 28.02.2013 | 18.06 | 19.34 | -1.28 | -6.63% | 280.93 | - 262.88 | -93.57% |
| 31.01.2013 | 19.34 | 33.88 | -14.55 | -42.93% | 287.60 | - 268.26 | -93.28% |
| 31.12.2012 | 33.88 | 33.94 | -0.06 | -0.16% | 289.97 | - 256.09 | -88.31% |
| 30.11.2012 | 33.94 | 33.71 | 0.23 | 0.68% | 279.00 | - 245.06 | -87.84% |
| 31.10.2012 | 33.71 | 31.41 | 2.30 | 7.32% | 251.20 | - 217.49 | -86.58% |
| 30.09.2012 | 31.41 | 33.49 | -2.08 | -6.21% | 11.51 | 19.90 | 172.87% |
| 31.08.2012 | 33.49 | 32.13 | 1.36 | 4.23% | 13.95 | 19.54 | 140.08% |
| 31.07.2012 | 32.13 | 31.43 | 0.71 | 2.26% | 10.10 | 22.04 | 218.17% |
| 30.06.2012 | 31.43 | 197.02 | - 165.59 | -84.05% | 9.97 | 21.46 | 215.33% |
| 31.05.2012 | 197.02 | 190.40 | 6.61 | 3.47% | 9.96 | 187.05 | 1 877.28% |
| 30.04.2012 | 190.40 | 278.16 | -87.75 | -31.55% | 9.86 | 180.55 | 1 831.65% |
| 31.03.2012 | 278.16 | 280.93 | -2.77 | -0.99% | 9.98 | 268.18 | 2 686.86% |
| 29.02.2012 | 280.93 | 287.60 | -6.67 | -2.32% | 9.84 | 271.09 | 2 754.71% |
| 31.01.2012 | 287.60 | 289.97 | -2.37 | -0.82% | 39.95 | 247.65 | 619.88% |
| 31.12.2011 | 289.97 | 279.00 | 10.97 | 3.93% | 40.88 | 249.10 | 609.36% |
| 30.11.2011 | 279.00 | 251.20 | 27.80 | 11.07% | 40.52 | 238.49 | 588.64% |
| 31.10.2011 | 251.20 | 11.51 | 239.69 | 2 082.11% | 40.17 | 211.03 | 525.29% |
| 30.09.2011 | 11.51 | 13.95 | -2.44 | -17.48% | 50.10 | -38.59 | -77.02% |
| 31.08.2011 | 13.95 | 10.10 | 3.85 | 38.13% | 50.11 | -36.16 | -72.16% |
| 31.07.2011 | 10.10 | 9.97 | 0.13 | 1.34% | 50.45 | -40.35 | -79.98% |
| 30.06.2011 | 9.97 | 9.96 | 0.00 | 0.02% | 50.89 | -40.92 | -80.42% |
| 31.05.2011 | 9.96 | 9.86 | 0.11 | 1.09% | 50.88 | -40.91 | -80.42% |
| 30.04.2011 | 9.86 | 9.98 | -0.12 | -1.24% | 50.86 | -41.01 | -80.62% |
| 31.03.2011 | 9.98 | 9.84 | 0.14 | 1.42% | 49.98 | -40.00 | -80.03% |
| 28.02.2011 | 9.84 | 39.95 | -30.11 | -75.37% | 49.23 | -39.39 | -80.01% |
| 31.01.2011 | 39.95 | 40.88 | -0.93 | -2.27% | 50.14 | -10.19 | -20.32% |
| 31.12.2010 | 40.88 | 40.52 | 0.36 | 0.90% | 69.28 | -28.40 | -41.00% |
| 30.11.2010 | 40.52 | 40.17 | 0.34 | 0.85% | 68.92 | -28.40 | -41.21% |
| 31.10.2010 | 40.17 | 50.10 | -9.92 | -19.81% | 79.69 | -39.52 | -49.59% |
| 30.09.2010 | 50.10 | 50.11 | -0.01 | -0.03% | 78.38 | -28.28 | -36.08% |
| 31.08.2010 | 50.11 | 50.45 | -0.34 | -0.67% | 78.44 | -28.33 | -36.12% |
| 31.07.2010 | 50.45 | 50.89 | -0.44 | -0.87% | 78.23 | -27.78 | -35.51% |
| 30.06.2010 | 50.89 | 50.88 | 0.01 | 0.03% | 77.80 | -26.91 | -34.59% |
| 31.05.2010 | 50.88 | 50.86 | 0.01 | 0.03% | 77.89 | -27.02 | -34.68% |
| 30.04.2010 | 50.86 | 49.98 | 0.89 | 1.77% | 76.51 | -25.65 | -33.52% |
| 31.03.2010 | 49.98 | 49.23 | 0.74 | 1.51% | 75.81 | -25.83 | -34.08% |
| 28.02.2010 | 49.23 | 50.14 | -0.91 | -1.81% | 76.17 | -26.94 | -35.37% |
| 31.01.2010 | 50.14 | 69.28 | -19.14 | -27.63% | 77.77 | -27.63 | -35.53% |
| 31.12.2009 | 69.28 | 68.92 | 0.36 | 0.52% | 57.99 | 11.29 | 19.46% |
| 30.11.2009 | 68.92 | 79.69 | -10.77 | -13.52% | 72.60 | -3.68 | -5.07% |
| 31.10.2009 | 79.69 | 78.38 | 1.32 | 1.68% | 72.60 | 7.09 | 9.77% |
| 30.09.2009 | 78.38 | 78.44 | -0.07 | -0.09% | 72.60 | 5.78 | 7.96% |
| 31.08.2009 | 78.44 | 78.23 | 0.22 | 0.28% | 90.76 | -12.32 | -13.57% |
| 31.07.2009 | 78.23 | 77.80 | 0.43 | 0.55% | 90.76 | -12.54 | -13.81% |
| 30.06.2009 | 77.80 | 77.89 | -0.10 | -0.12% | 90.76 | -12.97 | -14.29% |
| 31.05.2009 | 77.89 | 76.51 | 1.38 | 1.80% | 132.62 | -54.73 | -41.27% |
| 30.04.2009 | 76.51 | 75.81 | 0.70 | 0.92% | 132.62 | -56.11 | -42.31% |
| 31.03.2009 | 75.81 | 76.17 | -0.36 | -0.48% | 132.62 | -56.81 | -42.84% |
| 28.02.2009 | 76.17 | 77.77 | -1.59 | -2.05% | 181.73 | - 105.55 | -58.08% |
| 31.01.2009 | 77.77 | 57.99 | 19.78 | 34.10% | 181.73 | - 103.96 | -57.21% |
| 31.12.2008 | 57.99 | 72.60 | -14.61 | -20.12% | 181.73 | - 123.74 | -68.09% |
| 30.09.2008 | 72.60 | 90.76 | -18.17 | -20.01% | 458.20 | - 385.60 | -84.16% |
| 30.06.2008 | 90.76 | 132.62 | -41.86 | -31.56% | 518.12 | - 427.35 | -82.48% |
| 31.03.2008 | 132.62 | 181.73 | -49.10 | -27.02% | 494.13 | - 361.50 | -73.16% |
| 31.12.2007 | 181.73 | 458.20 | - 276.47 | -60.34% | 363.16 | - 181.43 | -49.96% |
| 30.09.2007 | 458.20 | 518.12 | -59.92 | -11.56% | 359.48 | 98.72 | 27.46% |
| 30.06.2007 | 518.12 | 494.13 | 23.99 | 4.85% | 358.76 | 159.35 | 44.42% |
| 31.03.2007 | 494.13 | 363.16 | 130.97 | 36.06% | 365.12 | 129.01 | 35.33% |
| 31.12.2006 | 363.16 | 359.48 | 3.68 | 1.02% | 366.04 | -2.88 | -0.79% |
| 30.09.2006 | 359.48 | 358.76 | 0.72 | 0.20% | 368.24 | -8.76 | -2.38% |
| 30.06.2006 | 358.76 | 365.12 | -6.36 | -1.74% | 370.82 | -12.06 | -3.25% |
| 31.03.2006 | 365.12 | 366.04 | -0.92 | -0.25% | 0.00 | 365.12 | - |
| 31.12.2005 | 366.04 | 368.24 | -2.20 | -0.60% | 0.00 | 366.04 | - |
| 30.09.2005 | 368.24 | 370.82 | -2.59 | -0.70% | 0.00 | 368.24 | - |
| 30.06.2005 | 370.82 | 0.00 | 370.82 | - | - | - | - |
| 31.03.2005 | 0.00 | 0.00 | 0.00 | - | - | - | - |
| 31.12.2004 | 0.00 | 0.00 | 0.00 | - | - | - | - |
| 30.09.2004 | 0.00 | - | - | - | - | - | - |
Graf jako obrázek

Podobné sestavy
Aplikace Ekonomika ČNB ze sekce makroekonomika zobrazuje časové řady hlavních makroekonomických údajů z ekonomiky ČR. Najdete zde přes 10.000 grafů různých hodnot od úrokových sazeb, přes statistiky státního rozpočtu, statistiky ČNB a data zpracovávaná ČSÚ. Data jsou k dispozici obvykle za posledních více než 20 let, od prosince roku 1992. Zdroj dat: ČNB ARAD

