Total risk exposure amount related to large exposures in the trading book - ekonomika ČNB
Aktualizace dat Total risk exposure amount related to large exposures in the trading book v této aplikaci skončila 30.6.2023. Aktualizovná data časových řad najdete na stránkách nové aplikace z dat ARAD ČNB
Nové časové řady makroekonomiky a jejich data
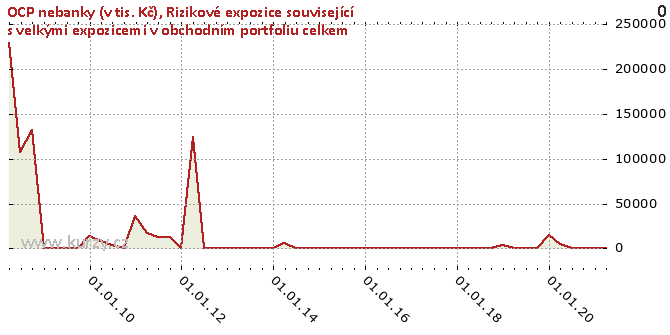
Graf hodnot, Investment firms - non-banks (in CZK thousands)
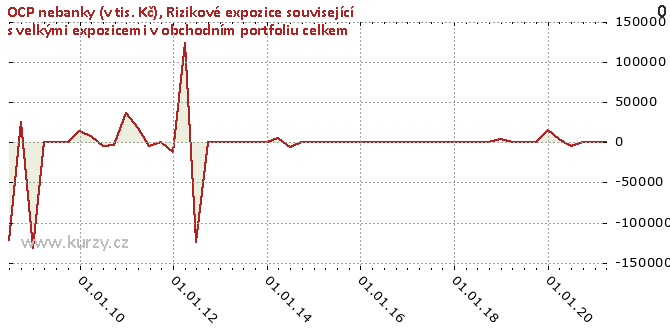
Přepočtený graf hodnot
Časová řada Total risk exposure amount related to large exposures in the trading book obsahuje kumulované roční údaje. Následující graf hodnot zobrazuje přepočtená rozdílová data.
Meziroční srovnání
Minima a maxima
| Typ | Období | Hodnota |
|---|---|---|
| Min | 30.06.2010 | 3 500.00 |
| Max | 31.03.2008 | 229 538.00 |
Historické hodnoty
| Období | Hodnota | Předchozí | Rozdíl | Změna | Před rokem | Rozdíl | Změna |
|---|---|---|---|---|---|---|---|
| 31.03.2020 | 4 508.00 | 14 779.00 | -10 271.00 | -69.50% | 0.00 | 4 508.00 | - |
| 31.12.2019 | 14 779.00 | 0.00 | 14 779.00 | - | 4 366.00 | 10 413.00 | 238.50% |
| 30.09.2019 | 0.00 | 0.00 | 0.00 | - | 0.00 | 0.00 | - |
| 30.06.2019 | 0.00 | 0.00 | 0.00 | - | 0.00 | 0.00 | - |
| 31.03.2019 | 0.00 | 4 366.00 | -4 366.00 | - | 0.00 | 0.00 | - |
| 31.12.2018 | 4 366.00 | 0.00 | 4 366.00 | - | 0.00 | 4 366.00 | - |
| 30.09.2018 | 0.00 | 0.00 | 0.00 | - | 0.00 | 0.00 | - |
| 30.06.2018 | 0.00 | 0.00 | 0.00 | - | 0.00 | 0.00 | - |
| 31.03.2018 | 0.00 | 0.00 | 0.00 | - | 0.00 | 0.00 | - |
| 31.12.2017 | 0.00 | 0.00 | 0.00 | - | 0.00 | 0.00 | - |
| 30.09.2017 | 0.00 | 0.00 | 0.00 | - | 0.00 | 0.00 | - |
| 30.06.2017 | 0.00 | 0.00 | 0.00 | - | 0.00 | 0.00 | - |
| 31.03.2017 | 0.00 | 0.00 | 0.00 | - | 0.00 | 0.00 | - |
| 31.12.2016 | 0.00 | 0.00 | 0.00 | - | 0.00 | 0.00 | - |
| 30.09.2016 | 0.00 | 0.00 | 0.00 | - | 0.00 | 0.00 | - |
| 30.06.2016 | 0.00 | 0.00 | 0.00 | - | 0.00 | 0.00 | - |
| 31.03.2016 | 0.00 | 0.00 | 0.00 | - | 0.00 | 0.00 | - |
| 31.12.2015 | 0.00 | 0.00 | 0.00 | - | 0.00 | 0.00 | - |
| 30.09.2015 | 0.00 | 0.00 | 0.00 | - | 0.00 | 0.00 | - |
| 30.06.2015 | 0.00 | 0.00 | 0.00 | - | 0.00 | 0.00 | - |
| 31.03.2015 | 0.00 | 0.00 | 0.00 | - | 5 835.00 | -5 835.00 | - |
| 31.12.2014 | 0.00 | 0.00 | 0.00 | - | 0.00 | 0.00 | - |
| 30.09.2014 | 0.00 | 0.00 | 0.00 | - | 0.00 | 0.00 | - |
| 30.06.2014 | 0.00 | 5 835.00 | -5 835.00 | - | 0.00 | 0.00 | - |
| 31.03.2014 | 5 835.00 | 0.00 | 5 835.00 | - | 0.00 | 5 835.00 | - |
| 31.12.2013 | 0.00 | 0.00 | 0.00 | - | 0.00 | 0.00 | - |
| 30.09.2013 | 0.00 | 0.00 | 0.00 | - | 0.00 | 0.00 | - |
| 30.06.2013 | 0.00 | 0.00 | 0.00 | - | 0.00 | 0.00 | - |
| 31.03.2013 | 0.00 | 0.00 | 0.00 | - | 124 350.00 | - 124 350.00 | - |
| 31.12.2012 | 0.00 | 0.00 | 0.00 | - | 0.00 | 0.00 | - |
| 30.09.2012 | 0.00 | 0.00 | 0.00 | - | 12 463.00 | -12 463.00 | - |
| 30.06.2012 | 0.00 | 124 350.00 | - 124 350.00 | - | 12 463.00 | -12 463.00 | - |
| 31.03.2012 | 124 350.00 | 0.00 | 124 350.00 | - | 17 225.00 | 107 125.00 | 621.92% |
| 31.12.2011 | 0.00 | 12 463.00 | -12 463.00 | - | 36 688.00 | -36 688.00 | - |
| 30.09.2011 | 12 463.00 | 12 463.00 | 0.00 | 0.00 | 0.00 | 12 463.00 | - |
| 30.06.2011 | 12 463.00 | 17 225.00 | -4 762.00 | -27.65% | 3 500.00 | 8 963.00 | 256.09% |
| 31.03.2011 | 17 225.00 | 36 688.00 | -19 463.00 | -53.05% | 7 738.00 | 9 487.00 | 122.60% |
| 31.12.2010 | 36 688.00 | 0.00 | 36 688.00 | - | 14 038.00 | 22 650.00 | 161.35% |
| 30.09.2010 | 0.00 | 3 500.00 | -3 500.00 | - | 0.00 | 0.00 | - |
| 30.06.2010 | 3 500.00 | 7 738.00 | -4 238.00 | -54.77% | 0.00 | 3 500.00 | - |
| 31.03.2010 | 7 738.00 | 14 038.00 | -6 300.00 | -44.88% | 0.00 | 7 738.00 | - |
| 31.12.2009 | 14 038.00 | 0.00 | 14 038.00 | - | 0.00 | 14 038.00 | - |
| 30.09.2009 | 0.00 | 0.00 | 0.00 | - | 132 313.00 | - 132 313.00 | - |
| 30.06.2009 | 0.00 | 0.00 | 0.00 | - | 107 150.00 | - 107 150.00 | - |
| 31.03.2009 | 0.00 | 0.00 | 0.00 | - | 229 538.00 | - 229 538.00 | - |
| 31.12.2008 | 0.00 | 132 313.00 | - 132 313.00 | - | - | - | - |
| 30.09.2008 | 132 313.00 | 107 150.00 | 25 163.00 | 23.48% | - | - | - |
| 30.06.2008 | 107 150.00 | 229 538.00 | - 122 388.00 | -53.32% | - | - | - |
| 31.03.2008 | 229 538.00 | - | - | - | - | - | - |
Graf jako obrázek


Podobné sestavy
Aplikace Ekonomika ČNB ze sekce makroekonomika zobrazuje časové řady hlavních makroekonomických údajů z ekonomiky ČR. Najdete zde přes 10.000 grafů různých hodnot od úrokových sazeb, přes statistiky státního rozpočtu, statistiky ČNB a data zpracovávaná ČSÚ. Data jsou k dispozici obvykle za posledních více než 20 let, od prosince roku 1992. Zdroj dat: ČNB ARAD
Příbuzné stránky
- SHIBA INU - aktuální a historické ceny kryptoměny SHIBA INU, graf vývoje ceny kryptoměny SHIBA INU - 2 dny - měna USD
- SHIBA INU - aktuální a historické ceny kryptoměny SHIBA INU, graf vývoje ceny kryptoměny SHIBA INU - 5 dnů - měna USD
- SHIBA INU - aktuální a historické ceny kryptoměny SHIBA INU, graf vývoje ceny kryptoměny SHIBA INU - 1 den - měna USD
- Floki Inu - aktuální a historické ceny kryptoměny Floki Inu, graf vývoje ceny kryptoměny Floki Inu - 2 dny - měna USD
- SHIBA INU - SHIB/ kurz
- Forex trading online - investice do EUR/USD a ostatních měn
- Total risk exposure amount for operational risk - ekonomika ČNB
- Farm to Fork: New rules to reduce the risk and use of pesticides in the EU
- "The most economical way to open up to the EU is to invest in Czechia”
- Elections to the Senate of the Parliament of the Czech Republic held in 2007
- Elections to the Senate of the Parliament of the Czech Republic held in 2018
- Elections to the Senate of the Parliament of the Czech Republic held in 2020

