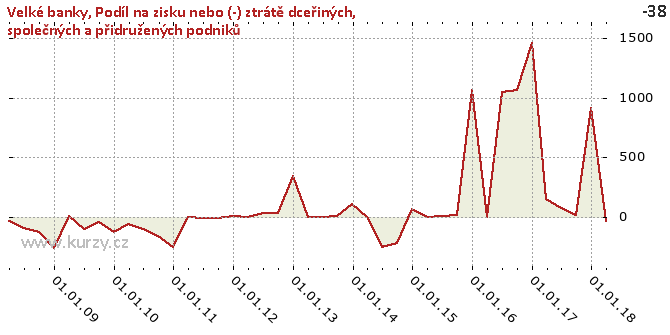
Share of the profit or (-) loss of investments in subsidaries, joint ventures and associates - ekonomika ČNB
Aktualizace dat
Share of the profit or (-) loss of investments in subsidaries, joint ventures and associates v této aplikaci skončila 30.6.2023. Aktualizovná data časových řad najdete na stránkách nové aplikace z dat
ARAD ČNB
Nové časové řady makroekonomiky a jejich data
| Data ke dni | Řada nebo sestava |
|---|
| 30.06.2024 |
Úvěry: Celkové náklady úvěrů domácnostem na bydlení v ČR vyjádřené ukazatelem cost of borrowing, Míra v %, Procenta, Měsíční |
| 30.06.2024 |
Úvěry: Celkove náklady úvěrů domácnostem na bydlení v EA vyjádřené ukazatelem cost of borrowing, Míra v %, Procenta, Měsíční |
| 30.06.2024 |
Úvěry: Celkové náklady úvěrů nefinančním podnikům v ČR vyjádřené ukazatelem cost of borrowing, Míra v %, Procenta, Měsíční |
| 30.06.2024 |
Úvěry: Celkové náklady úvěrů nefinančním podnikům v EA vyjádřené ukazatelem cost of borrowing, Míra v %, Procenta, Měsíční |
| - |
Podmíněný KD odliv(-)/příliv(+) deviz.aktiv (nominál.ocenění): Měsíční, Záznam o devizových opcích, které jsou in-the-money, USD |
| - |
Podmíněný KD odliv(-)/příliv(+) deviz.aktiv (nominál.ocenění): Měsíční, Záznam o devizových opcích, které jsou in-the-money, Do 1 měsíce, USD |
| - |
Podmíněný KD odliv(-)/příliv(+) deviz.aktiv (nominál.ocenění): Měsíční, Záznam o devizových opcích, které jsou in-the-money, Nad 1 měsíc do 3 měsíců, USD |
| - |
Podmíněný KD odliv(-)/příliv(+) deviz.aktiv (nominál.ocenění): Měsíční, Záznam o devizových opcích, které jsou in-the-money, Nad 3 měsíce do 1 roku, USD |
Graf hodnot, Large banks
 Nahrávám interaktivní graf ...
Meziroční srovnání
Share of the profit or (-) loss of investments in subsidaries, joint ventures and associates - Nahrávám graf - roční srovnání ...
Minima a maxima
Historické hodnoty
| Období |
Hodnota |
Předchozí |
Rozdíl |
Změna |
Před rokem |
Rozdíl |
Změna |
| 31.03.2018 |
-38.00 |
916.00 |
- 954.00 |
- 104.15% |
145.00 |
- 183.00 |
- 126.21% |
| 31.12.2017 |
916.00 |
14.00 |
902.00 |
6 442.86% |
1 462.00 |
- 546.00 |
-37.35% |
| 30.09.2017 |
14.00 |
72.00 |
-58.00 |
-80.56% |
1 060.00 |
-1 046.00 |
-98.68% |
| 30.06.2017 |
72.00 |
145.00 |
-73.00 |
-50.34% |
1 046.00 |
- 974.00 |
-93.12% |
| 31.03.2017 |
145.00 |
1 462.00 |
-1 317.00 |
-90.08% |
0.00 |
145.00 |
- |
| 31.12.2016 |
1 462.00 |
1 060.00 |
402.00 |
37.92% |
1 066.00 |
396.00 |
37.15% |
| 30.09.2016 |
1 060.00 |
1 046.00 |
14.00 |
1.34% |
10.00 |
1 050.00 |
10 500.00% |
| 30.06.2016 |
1 046.00 |
0.00 |
1 046.00 |
- |
5.00 |
1 041.00 |
20 820.00% |
| 31.03.2016 |
0.00 |
1 066.00 |
-1 066.00 |
- |
-3.00 |
3.00 |
- |
| 31.12.2015 |
1 066.00 |
10.00 |
1 056.00 |
10 560.00% |
60.00 |
1 006.00 |
1 676.67% |
| 30.09.2015 |
10.00 |
5.00 |
5.00 |
100.00% |
- 220.00 |
230.00 |
- 104.55% |
| 30.06.2015 |
5.00 |
-3.00 |
8.00 |
- 266.67% |
- 257.00 |
262.00 |
- 101.95% |
| 31.03.2015 |
-3.00 |
60.00 |
-63.00 |
- 105.00% |
0.00 |
-3.00 |
- |
| 31.12.2014 |
60.00 |
- 220.00 |
280.00 |
- 127.27% |
104.00 |
-44.00 |
-42.31% |
| 30.09.2014 |
- 220.00 |
- 257.00 |
37.00 |
-14.40% |
6.00 |
- 226.00 |
-3 766.67% |
| 30.06.2014 |
- 257.00 |
0.00 |
- 257.00 |
- |
0.00 |
- 257.00 |
- |
| 31.03.2014 |
0.00 |
104.00 |
- 104.00 |
- |
0.00 |
0.00 |
- |
| 31.12.2013 |
104.00 |
6.00 |
98.00 |
1 633.33% |
339.00 |
- 235.00 |
-69.32% |
| 30.09.2013 |
6.00 |
0.00 |
6.00 |
- |
33.00 |
-27.00 |
-81.82% |
| 30.06.2013 |
0.00 |
0.00 |
0.00 |
- |
29.00 |
-29.00 |
- |
| 31.03.2013 |
0.00 |
339.00 |
- 339.00 |
- |
-1.00 |
1.00 |
- |
| 31.12.2012 |
339.00 |
33.00 |
306.00 |
927.27% |
7.00 |
332.00 |
4 742.86% |
| 30.09.2012 |
33.00 |
29.00 |
4.00 |
13.79% |
-12.00 |
45.00 |
- 375.00% |
| 30.06.2012 |
29.00 |
-1.00 |
30.00 |
-3 000.00% |
-9.00 |
38.00 |
- 422.22% |
| 31.03.2012 |
-1.00 |
7.00 |
-8.00 |
- 114.29% |
-5.00 |
4.00 |
-80.00% |
| 31.12.2011 |
7.00 |
-12.00 |
19.00 |
- 158.33% |
- 251.00 |
258.00 |
- 102.79% |
| 30.09.2011 |
-12.00 |
-9.00 |
-3.00 |
33.33% |
- 160.00 |
148.00 |
-92.50% |
| 30.06.2011 |
-9.00 |
-5.00 |
-4.00 |
80.00% |
- 103.00 |
94.00 |
-91.26% |
| 31.03.2011 |
-5.00 |
- 251.00 |
246.00 |
-98.01% |
-60.00 |
55.00 |
-91.67% |
| 31.12.2010 |
- 251.00 |
- 160.00 |
-91.00 |
56.88% |
- 131.00 |
- 120.00 |
91.60% |
| 30.09.2010 |
- 160.00 |
- 103.00 |
-57.00 |
55.34% |
-46.00 |
- 114.00 |
247.83% |
| 30.06.2010 |
- 103.00 |
-60.00 |
-43.00 |
71.67% |
- 103.00 |
0.00 |
0.00 |
| 31.03.2010 |
-60.00 |
- 131.00 |
71.00 |
-54.20% |
3.00 |
-63.00 |
-2 100.00% |
| 31.12.2009 |
- 131.00 |
-46.00 |
-85.00 |
184.78% |
- 267.00 |
136.00 |
-50.94% |
| 30.09.2009 |
-46.00 |
- 103.00 |
57.00 |
-55.34% |
- 133.00 |
87.00 |
-65.41% |
| 30.06.2009 |
- 103.00 |
3.00 |
- 106.00 |
-3 533.33% |
-93.00 |
-10.00 |
10.75% |
| 31.03.2009 |
3.00 |
- 267.00 |
270.00 |
- 101.12% |
-33.00 |
36.00 |
- 109.09% |
| 31.12.2008 |
- 267.00 |
- 133.00 |
- 134.00 |
100.75% |
- |
- |
- |
| 30.09.2008 |
- 133.00 |
-93.00 |
-40.00 |
43.01% |
- |
- |
- |
| 30.06.2008 |
-93.00 |
-33.00 |
-60.00 |
181.82% |
- |
- |
- |
| 31.03.2008 |
-33.00 |
- |
- |
- |
- |
- |
- |
Graf jako obrázek
Ekonomické ukazatele České národní banky
Podobné sestavy
| Vyberte název statistické sestavy dat, kterou chcete prohlédnout |
|---|
|
Share of the profit or (-) loss of investments in subsidaries, joint ventures and associates (Banking sector, total)
|
|
Share of the profit or (-) loss of investments in subsidaries, joint ventures and associates (Large banks)
|
|
Share of the profit or (-) loss of investments in subsidaries, joint ventures and associates (Medium-sized banks)
|
|
Share of the profit or (-) loss of investments in subsidaries, joint ventures and associates (Building societies)
|
|
Share of the profit or (-) loss of investments in subsidaries, joint ventures and associates (P&L statement (in CZK thousands))
|
|
Share of the profit or (-) loss of investments in subsidaries, joint ventures and associates (Small banks)
|
|
Share of the profit or (-) loss of investments in subsidaries, joint ventures and associates (Foreign bank branches)
|
|
Share of the profit or (-) loss of investments in subsidaries, joint ventures and associates (Investment firms total (in CZK thousands))
|
|
Share of the profit or (-) loss of investments in subsidaries, joint ventures and associates (Investment firms - non-banks (in CZK thousands))
|
|
Share of the profit or (-) loss of investments in subsidaries, joint ventures and associates (Foreign IFs branches (in CZK thousands))
|
|
Monetary and financial statistics (Statistical data)
|
|
Statistics of monetary developments in the CR (Monetary statistics)
|
|
Aggregated balance sheet of the Czech National Bank - assets (Balance sheet of the Czech National Bank)
|
|
Holdings of securities other than shares issued by residents - total (Aggregated balance sheet of the Czech National Bank - assets)
|
|
Holdings of securities other than shares issued by residents - MFIs (Aggregated balance sheet of the Czech National Bank - assets)
|
|
Holdings of securities other than shares issued by residents - General government (Aggregated balance sheet of the Czech National Bank - assets)
|
|
Holdings of securities other than shares issued by residents - Other residents (Aggregated balance sheet of the Czech National Bank - assets)
|
|
Holdings of shares/ other equity issued by residents - total (Aggregated balance sheet of the Czech National Bank - assets)
|
|
Holdings of shares/ other equity issued by residents - MFIs (Aggregated balance sheet of the Czech National Bank - assets)
|
|
Holdings of shares/ other equity issued by residents - Other residents (Aggregated balance sheet of the Czech National Bank - assets)
|
Aplikace Ekonomika ČNB ze sekce makroekonomika
zobrazuje časové řady hlavních makroekonomických údajů z ekonomiky ČR.
Najdete zde přes 10.000 grafů různých hodnot od úrokových sazeb, přes statistiky státního rozpočtu, statistiky ČNB a data zpracovávaná ČSÚ.
Data jsou k dispozici obvykle za posledních více než 20 let, od prosince roku 1992.
Zdroj dat: ČNB ARAD
Zobrazit sloupec


