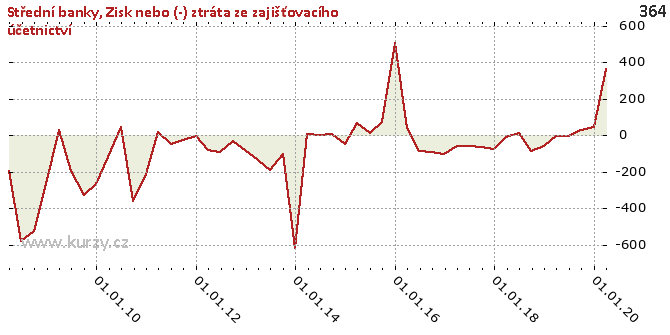
Gains or (-) losses from hedge accounting, net - ekonomika ČNB
Aktualizace dat Gains or (-) losses from hedge accounting, net v této aplikaci skončila 30.6.2023. Aktualizovná data časových řad najdete na stránkách nové aplikace z dat ARAD ČNB
Nové časové řady makroekonomiky a jejich data
Graf hodnot, Medium-sized banks
Meziroční srovnání
Minima a maxima
| Typ | Období | Hodnota |
|---|---|---|
| Max | 31.12.2015 | 507.00 |
| Min | 31.12.2013 | - 619.00 |
Historické hodnoty
| Období | Hodnota | Předchozí | Rozdíl | Změna | Před rokem | Rozdíl | Změna |
|---|---|---|---|---|---|---|---|
| 31.03.2020 | 364.00 | 43.00 | 321.00 | 746.51% | -2.00 | 366.00 | -18 300.00% |
| 31.12.2019 | 43.00 | 28.00 | 15.00 | 53.57% | -60.00 | 103.00 | - 171.67% |
| 30.09.2019 | 28.00 | -6.00 | 34.00 | - 566.67% | -87.00 | 115.00 | - 132.18% |
| 30.06.2019 | -6.00 | -2.00 | -4.00 | 200.00% | 12.00 | -18.00 | - 150.00% |
| 31.03.2019 | -2.00 | -60.00 | 58.00 | -96.67% | -9.00 | 7.00 | -77.78% |
| 31.12.2018 | -60.00 | -87.00 | 27.00 | -31.03% | -74.00 | 14.00 | -18.92% |
| 30.09.2018 | -87.00 | 12.00 | -99.00 | - 825.00% | -65.00 | -22.00 | 33.85% |
| 30.06.2018 | 12.00 | -9.00 | 21.00 | - 233.33% | -57.00 | 69.00 | - 121.05% |
| 31.03.2018 | -9.00 | -74.00 | 65.00 | -87.84% | -59.00 | 50.00 | -84.75% |
| 31.12.2017 | -74.00 | -65.00 | -9.00 | 13.85% | - 103.00 | 29.00 | -28.16% |
| 30.09.2017 | -65.00 | -57.00 | -8.00 | 14.04% | -94.00 | 29.00 | -30.85% |
| 30.06.2017 | -57.00 | -59.00 | 2.00 | -3.39% | -87.00 | 30.00 | -34.48% |
| 31.03.2017 | -59.00 | - 103.00 | 44.00 | -42.72% | 37.00 | -96.00 | - 259.46% |
| 31.12.2016 | - 103.00 | -94.00 | -9.00 | 9.57% | 507.00 | - 610.00 | - 120.32% |
| 30.09.2016 | -94.00 | -87.00 | -7.00 | 8.05% | 75.00 | - 169.00 | - 225.33% |
| 30.06.2016 | -87.00 | 37.00 | - 124.00 | - 335.14% | 10.00 | -97.00 | - 970.00% |
| 31.03.2016 | 37.00 | 507.00 | - 470.00 | -92.70% | 65.00 | -28.00 | -43.08% |
| 31.12.2015 | 507.00 | 75.00 | 432.00 | 576.00% | -46.00 | 553.00 | -1 202.17% |
| 30.09.2015 | 75.00 | 10.00 | 65.00 | 650.00% | 6.00 | 69.00 | 1 150.00% |
| 30.06.2015 | 10.00 | 65.00 | -55.00 | -84.62% | 2.00 | 8.00 | 400.00% |
| 31.03.2015 | 65.00 | -46.00 | 111.00 | - 241.30% | 5.00 | 60.00 | 1 200.00% |
| 31.12.2014 | -46.00 | 6.00 | -52.00 | - 866.67% | - 619.00 | 573.00 | -92.57% |
| 30.09.2014 | 6.00 | 2.00 | 4.00 | 200.00% | - 104.00 | 110.00 | - 105.77% |
| 30.06.2014 | 2.00 | 5.00 | -3.00 | -60.00% | - 190.00 | 192.00 | - 101.05% |
| 31.03.2014 | 5.00 | - 619.00 | 624.00 | - 100.81% | - 135.00 | 140.00 | - 103.70% |
| 31.12.2013 | - 619.00 | - 104.00 | - 515.00 | 495.19% | -78.00 | - 541.00 | 693.59% |
| 30.09.2013 | - 104.00 | - 190.00 | 86.00 | -45.26% | -31.00 | -73.00 | 235.48% |
| 30.06.2013 | - 190.00 | - 135.00 | -55.00 | 40.74% | -93.00 | -97.00 | 104.30% |
| 31.03.2013 | - 135.00 | -78.00 | -57.00 | 73.08% | -82.00 | -53.00 | 64.63% |
| 31.12.2012 | -78.00 | -31.00 | -47.00 | 151.61% | -5.00 | -73.00 | 1 460.00% |
| 30.09.2012 | -31.00 | -93.00 | 62.00 | -66.67% | -25.00 | -6.00 | 24.00% |
| 30.06.2012 | -93.00 | -82.00 | -11.00 | 13.41% | -47.00 | -46.00 | 97.87% |
| 31.03.2012 | -82.00 | -5.00 | -77.00 | 1 540.00% | 19.00 | - 101.00 | - 531.58% |
| 31.12.2011 | -5.00 | -25.00 | 20.00 | -80.00% | - 212.00 | 207.00 | -97.64% |
| 30.09.2011 | -25.00 | -47.00 | 22.00 | -46.81% | - 358.00 | 333.00 | -93.02% |
| 30.06.2011 | -47.00 | 19.00 | -66.00 | - 347.37% | 43.00 | -90.00 | - 209.30% |
| 31.03.2011 | 19.00 | - 212.00 | 231.00 | - 108.96% | - 118.00 | 137.00 | - 116.10% |
| 31.12.2010 | - 212.00 | - 358.00 | 146.00 | -40.78% | - 267.00 | 55.00 | -20.60% |
| 30.09.2010 | - 358.00 | 43.00 | - 401.00 | - 932.56% | - 328.00 | -30.00 | 9.15% |
| 30.06.2010 | 43.00 | - 118.00 | 161.00 | - 136.44% | - 196.00 | 239.00 | - 121.94% |
| 31.03.2010 | - 118.00 | - 267.00 | 149.00 | -55.81% | 29.00 | - 147.00 | - 506.90% |
| 31.12.2009 | - 267.00 | - 328.00 | 61.00 | -18.60% | - 264.00 | -3.00 | 1.14% |
| 30.09.2009 | - 328.00 | - 196.00 | - 132.00 | 67.35% | - 525.00 | 197.00 | -37.52% |
| 30.06.2009 | - 196.00 | 29.00 | - 225.00 | - 775.86% | - 576.00 | 380.00 | -65.97% |
| 31.03.2009 | 29.00 | - 264.00 | 293.00 | - 110.98% | - 198.00 | 227.00 | - 114.65% |
| 31.12.2008 | - 264.00 | - 525.00 | 261.00 | -49.71% | - | - | - |
| 30.09.2008 | - 525.00 | - 576.00 | 51.00 | -8.85% | - | - | - |
| 30.06.2008 | - 576.00 | - 198.00 | - 378.00 | 190.91% | - | - | - |
| 31.03.2008 | - 198.00 | - | - | - | - | - | - |
Graf jako obrázek

Podobné sestavy
Aplikace Ekonomika ČNB ze sekce makroekonomika zobrazuje časové řady hlavních makroekonomických údajů z ekonomiky ČR. Najdete zde přes 10.000 grafů různých hodnot od úrokových sazeb, přes statistiky státního rozpočtu, statistiky ČNB a data zpracovávaná ČSÚ. Data jsou k dispozici obvykle za posledních více než 20 let, od prosince roku 1992. Zdroj dat: ČNB ARAD

