Manufactured goods classified chiefly by materials - ekonomika ČNB
Aktualizace dat Manufactured goods classified chiefly by materials v této aplikaci skončila 30.6.2023. Aktualizovná data časových řad najdete na stránkách nové aplikace z dat ARAD ČNB
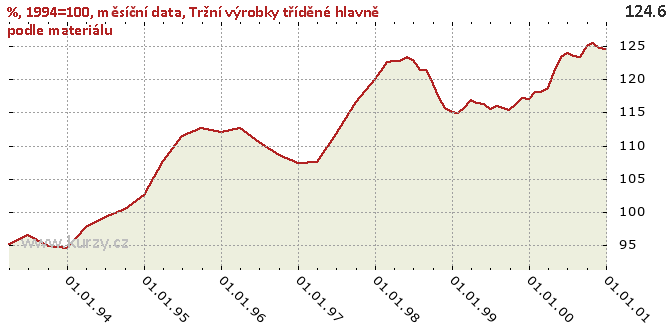
Graf hodnot, %, 1994=100, monthly data
Meziroční srovnání
Minima a maxima
| Typ | Období | Hodnota |
|---|---|---|
| Max | 31.10.2000 | 125.50 |
| Min | 31.12.1993 | 94.50 |
Historické hodnoty
| Období | Hodnota | Předchozí | Rozdíl | Změna | Před rokem | Rozdíl | Změna |
|---|---|---|---|---|---|---|---|
| 31.12.2000 | 124.60 | 124.70 | -0.10 | -0.08% | 117.00 | 7.60 | 6.50% |
| 30.11.2000 | 124.70 | 125.50 | -0.80 | -0.64% | 117.10 | 7.60 | 6.49% |
| 31.10.2000 | 125.50 | 125.00 | 0.50 | 0.40% | 116.30 | 9.20 | 7.91% |
| 30.09.2000 | 125.00 | 123.30 | 1.70 | 1.38% | 115.30 | 9.70 | 8.41% |
| 31.08.2000 | 123.30 | 123.50 | -0.20 | -0.16% | 115.60 | 7.70 | 6.66% |
| 31.07.2000 | 123.50 | 123.90 | -0.40 | -0.32% | 115.90 | 7.60 | 6.56% |
| 30.06.2000 | 123.90 | 123.40 | 0.50 | 0.41% | 115.50 | 8.40 | 7.27% |
| 31.05.2000 | 123.40 | 121.10 | 2.30 | 1.90% | 116.20 | 7.20 | 6.20% |
| 30.04.2000 | 121.10 | 118.60 | 2.50 | 2.11% | 116.40 | 4.70 | 4.04% |
| 31.03.2000 | 118.60 | 118.00 | 0.60 | 0.51% | 116.90 | 1.70 | 1.45% |
| 29.02.2000 | 118.00 | 118.10 | -0.10 | -0.08% | 115.70 | 2.30 | 1.99% |
| 31.01.2000 | 118.10 | 117.00 | 1.10 | 0.94% | 114.90 | 3.20 | 2.79% |
| 31.12.1999 | 117.00 | 117.10 | -0.10 | -0.09% | 115.00 | 2.00 | 1.74% |
| 30.11.1999 | 117.10 | 116.30 | 0.80 | 0.69% | 115.60 | 1.50 | 1.30% |
| 31.10.1999 | 116.30 | 115.30 | 1.00 | 0.87% | 117.20 | -0.90 | -0.77% |
| 30.09.1999 | 115.30 | 115.60 | -0.30 | -0.26% | 119.30 | -4.00 | -3.35% |
| 31.08.1999 | 115.60 | 115.90 | -0.30 | -0.26% | 121.30 | -5.70 | -4.70% |
| 31.07.1999 | 115.90 | 115.50 | 0.40 | 0.35% | 121.40 | -5.50 | -4.53% |
| 30.06.1999 | 115.50 | 116.20 | -0.70 | -0.60% | 122.90 | -7.40 | -6.02% |
| 31.05.1999 | 116.20 | 116.40 | -0.20 | -0.17% | 123.40 | -7.20 | -5.83% |
| 30.04.1999 | 116.40 | 116.90 | -0.50 | -0.43% | 122.80 | -6.40 | -5.21% |
| 31.03.1999 | 116.90 | 115.70 | 1.20 | 1.04% | 122.70 | -5.80 | -4.73% |
| 28.02.1999 | 115.70 | 114.90 | 0.80 | 0.70% | 122.60 | -6.90 | -5.63% |
| 31.01.1999 | 114.90 | 115.00 | -0.10 | -0.09% | 121.20 | -6.30 | -5.20% |
| 31.12.1998 | 115.00 | 115.60 | -0.60 | -0.52% | 120.00 | -5.00 | -4.17% |
| 30.11.1998 | 115.60 | 117.20 | -1.60 | -1.37% | 116.50 | -0.90 | -0.77% |
| 31.10.1998 | 117.20 | 119.30 | -2.10 | -1.76% | 116.50 | 0.70 | 0.60% |
| 30.09.1998 | 119.30 | 121.30 | -2.00 | -1.65% | 116.50 | 2.80 | 2.40% |
| 31.08.1998 | 121.30 | 121.40 | -0.10 | -0.08% | 111.70 | 9.60 | 8.59% |
| 31.07.1998 | 121.40 | 122.90 | -1.50 | -1.22% | 111.70 | 9.70 | 8.68% |
| 30.06.1998 | 122.90 | 123.40 | -0.50 | -0.41% | 111.70 | 11.20 | 10.03% |
| 31.05.1998 | 123.40 | 122.80 | 0.60 | 0.49% | 107.50 | 15.90 | 14.79% |
| 30.04.1998 | 122.80 | 122.70 | 0.10 | 0.08% | 107.50 | 15.30 | 14.23% |
| 31.03.1998 | 122.70 | 122.60 | 0.10 | 0.08% | 107.50 | 15.20 | 14.14% |
| 28.02.1998 | 122.60 | 121.20 | 1.40 | 1.16% | 107.30 | 15.30 | 14.26% |
| 31.01.1998 | 121.20 | 120.00 | 1.20 | 1.00% | 107.30 | 13.90 | 12.95% |
| 31.12.1997 | 120.00 | 116.50 | 3.50 | 3.00% | 107.30 | 12.70 | 11.84% |
| 30.09.1997 | 116.50 | 111.70 | 4.80 | 4.30% | 108.60 | 7.90 | 7.27% |
| 30.06.1997 | 111.70 | 107.50 | 4.20 | 3.91% | 110.50 | 1.20 | 1.09% |
| 31.03.1997 | 107.50 | 107.30 | 0.20 | 0.19% | 112.70 | -5.20 | -4.61% |
| 31.12.1996 | 107.30 | 108.60 | -1.30 | -1.20% | 112.10 | -4.80 | -4.28% |
| 30.09.1996 | 108.60 | 110.50 | -1.90 | -1.72% | 112.70 | -4.10 | -3.64% |
| 30.06.1996 | 110.50 | 112.70 | -2.20 | -1.95% | 111.40 | -0.90 | -0.81% |
| 31.03.1996 | 112.70 | 112.10 | 0.60 | 0.54% | 107.60 | 5.10 | 4.74% |
| 31.12.1995 | 112.10 | 112.70 | -0.60 | -0.53% | 102.60 | 9.50 | 9.26% |
| 30.09.1995 | 112.70 | 111.40 | 1.30 | 1.17% | 100.40 | 12.30 | 12.25% |
| 30.06.1995 | 111.40 | 107.60 | 3.80 | 3.53% | 99.20 | 12.20 | 12.30% |
| 31.03.1995 | 107.60 | 102.60 | 5.00 | 4.87% | 97.80 | 9.80 | 10.02% |
| 31.12.1994 | 102.60 | 100.40 | 2.20 | 2.19% | 94.50 | 8.10 | 8.57% |
| 30.09.1994 | 100.40 | 99.20 | 1.20 | 1.21% | 94.80 | 5.60 | 5.91% |
| 30.06.1994 | 99.20 | 97.80 | 1.40 | 1.43% | 96.50 | 2.70 | 2.80% |
| 31.03.1994 | 97.80 | 94.50 | 3.30 | 3.49% | 95.20 | 2.60 | 2.73% |
| 31.12.1993 | 94.50 | 94.80 | -0.30 | -0.32% | - | - | - |
| 30.09.1993 | 94.80 | 96.50 | -1.70 | -1.76% | - | - | - |
| 30.06.1993 | 96.50 | 95.20 | 1.30 | 1.37% | - | - | - |
| 31.03.1993 | 95.20 | - | - | - | - | - | - |
Graf jako obrázek

Podobné sestavy
Aplikace Ekonomika ČNB ze sekce makroekonomika zobrazuje časové řady hlavních makroekonomických údajů z ekonomiky ČR. Najdete zde přes 10.000 grafů různých hodnot od úrokových sazeb, přes statistiky státního rozpočtu, statistiky ČNB a data zpracovávaná ČSÚ. Data jsou k dispozici obvykle za posledních více než 20 let, od prosince roku 1992. Zdroj dat: ČNB ARAD
Příbuzné stránky
- Žádost o roční zúčtování záloh a daňového zvýhodnění 25 5457/B (vzor číslo 3)
- Míra inflace (roční klouzavý průměr), Roční součty - ekonomika ČNB
- roční míra růstu (v %), Roční součty - ekonomika ČNB
- Poradci: Trump by měl usilovat o snížení bilanční sumy Fedu
- Češi platí za tarify obří sumy. Úřad řekl, kdy by se to mělo změnit
- Indexy cen stavebních pozemků (průměr 2010 = 100), čtvrtletní data, Roční součty - ekonomika ČNB
- DzP fyzické osoby - z přiznání, Roční součty - ekonomika ČNB
- Výnos koše státních dluhopisů s průměrnou zbytkovou splatností 10 let, Roční součty - ekonomika ČNB
- Náklady příštích období, Roční součty - ekonomika ČNB

