Cellulose, paper, paperboard and articles thereof - ekonomika ČNB
Aktualizace dat Cellulose, paper, paperboard and articles thereof v této aplikaci skončila 30.6.2023. Aktualizovná data časových řad najdete na stránkách nové aplikace z dat ARAD ČNB
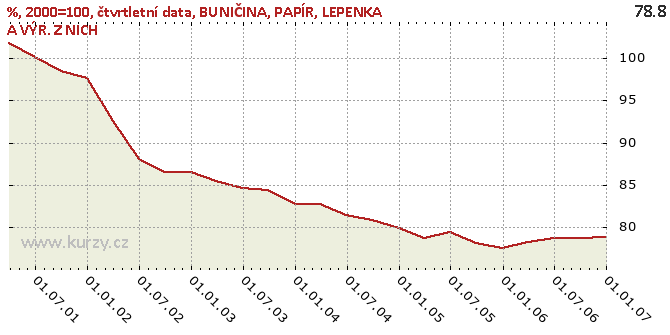
Graf hodnot, %, 2000=100, quarterly data
Meziroční srovnání
Minima a maxima
| Typ | Období | Hodnota |
|---|---|---|
| Min | 31.12.2005 | 77.50 |
| Max | 31.03.2001 | 101.80 |
Historické hodnoty
| Období | Hodnota | Předchozí | Rozdíl | Změna | Před rokem | Rozdíl | Změna |
|---|---|---|---|---|---|---|---|
| 31.12.2006 | 78.80 | 78.70 | 0.10 | 0.13% | 77.50 | 1.30 | 1.68% |
| 30.09.2006 | 78.70 | 78.70 | 0.00 | 0.00 | 78.10 | 0.60 | 0.77% |
| 30.06.2006 | 78.70 | 78.30 | 0.40 | 0.51% | 79.40 | -0.70 | -0.88% |
| 31.03.2006 | 78.30 | 77.50 | 0.80 | 1.03% | 78.70 | -0.40 | -0.51% |
| 31.12.2005 | 77.50 | 78.10 | -0.60 | -0.77% | 79.90 | -2.40 | -3.00% |
| 30.09.2005 | 78.10 | 79.40 | -1.30 | -1.64% | 80.80 | -2.70 | -3.34% |
| 30.06.2005 | 79.40 | 78.70 | 0.70 | 0.89% | 81.50 | -2.10 | -2.58% |
| 31.03.2005 | 78.70 | 79.90 | -1.20 | -1.50% | 82.80 | -4.10 | -4.95% |
| 31.12.2004 | 79.90 | 80.80 | -0.90 | -1.11% | 82.80 | -2.90 | -3.50% |
| 30.09.2004 | 80.80 | 81.50 | -0.70 | -0.86% | 84.40 | -3.60 | -4.27% |
| 30.06.2004 | 81.50 | 82.80 | -1.30 | -1.57% | 84.60 | -3.10 | -3.66% |
| 31.03.2004 | 82.80 | 82.80 | 0.00 | 0.00 | 85.50 | -2.70 | -3.16% |
| 31.12.2003 | 82.80 | 84.40 | -1.60 | -1.90% | 86.50 | -3.70 | -4.28% |
| 30.09.2003 | 84.40 | 84.60 | -0.20 | -0.24% | 86.50 | -2.10 | -2.43% |
| 30.06.2003 | 84.60 | 85.50 | -0.90 | -1.05% | 88.00 | -3.40 | -3.86% |
| 31.03.2003 | 85.50 | 86.50 | -1.00 | -1.16% | 92.60 | -7.10 | -7.67% |
| 31.12.2002 | 86.50 | 86.50 | 0.00 | 0.00 | 97.60 | -11.10 | -11.37% |
| 30.09.2002 | 86.50 | 88.00 | -1.50 | -1.70% | 98.50 | -12.00 | -12.18% |
| 30.06.2002 | 88.00 | 92.60 | -4.60 | -4.97% | 100.10 | -12.10 | -12.09% |
| 31.03.2002 | 92.60 | 97.60 | -5.00 | -5.12% | 101.80 | -9.20 | -9.04% |
| 31.12.2001 | 97.60 | 98.50 | -0.90 | -0.91% | - | - | - |
| 30.09.2001 | 98.50 | 100.10 | -1.60 | -1.60% | - | - | - |
| 30.06.2001 | 100.10 | 101.80 | -1.70 | -1.67% | - | - | - |
| 31.03.2001 | 101.80 | - | - | - | - | - | - |
Graf jako obrázek

Podobné sestavy
Aplikace Ekonomika ČNB ze sekce makroekonomika zobrazuje časové řady hlavních makroekonomických údajů z ekonomiky ČR. Najdete zde přes 10.000 grafů různých hodnot od úrokových sazeb, přes statistiky státního rozpočtu, statistiky ČNB a data zpracovávaná ČSÚ. Data jsou k dispozici obvykle za posledních více než 20 let, od prosince roku 1992. Zdroj dat: ČNB ARAD

