Products of the chemical industry and related branches - ekonomika ČNB
Aktualizace dat Products of the chemical industry and related branches v této aplikaci skončila 30.6.2023. Aktualizovná data časových řad najdete na stránkách nové aplikace z dat ARAD ČNB
Nové časové řady makroekonomiky a jejich data
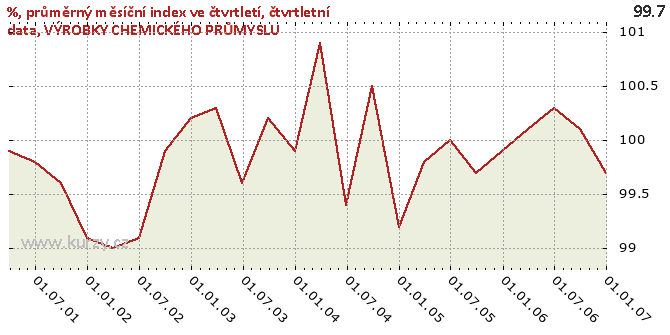
Graf hodnot, %, average monthly index in a quarter, quarterly data
Meziroční srovnání
Minima a maxima
| Typ | Období | Hodnota |
|---|---|---|
| Max | 31.03.2004 | 100.90 |
| Min | 31.03.2002 | 99.00 |
Historické hodnoty
| Období | Hodnota | Předchozí | Rozdíl | Změna | Před rokem | Rozdíl | Změna |
|---|---|---|---|---|---|---|---|
| 31.12.2006 | 99.70 | 100.10 | -0.40 | -0.40% | 99.90 | -0.20 | -0.20% |
| 30.09.2006 | 100.10 | 100.30 | -0.20 | -0.20% | 99.70 | 0.40 | 0.40% |
| 30.06.2006 | 100.30 | 100.10 | 0.20 | 0.20% | 100.00 | 0.30 | 0.30% |
| 31.03.2006 | 100.10 | 99.90 | 0.20 | 0.20% | 99.80 | 0.30 | 0.30% |
| 31.12.2005 | 99.90 | 99.70 | 0.20 | 0.20% | 99.20 | 0.70 | 0.71% |
| 30.09.2005 | 99.70 | 100.00 | -0.30 | -0.30% | 100.50 | -0.80 | -0.80% |
| 30.06.2005 | 100.00 | 99.80 | 0.20 | 0.20% | 99.40 | 0.60 | 0.60% |
| 31.03.2005 | 99.80 | 99.20 | 0.60 | 0.60% | 100.90 | -1.10 | -1.09% |
| 31.12.2004 | 99.20 | 100.50 | -1.30 | -1.29% | 99.90 | -0.70 | -0.70% |
| 30.09.2004 | 100.50 | 99.40 | 1.10 | 1.11% | 100.20 | 0.30 | 0.30% |
| 30.06.2004 | 99.40 | 100.90 | -1.50 | -1.49% | 99.60 | -0.20 | -0.20% |
| 31.03.2004 | 100.90 | 99.90 | 1.00 | 1.00% | 100.30 | 0.60 | 0.60% |
| 31.12.2003 | 99.90 | 100.20 | -0.30 | -0.30% | 100.20 | -0.30 | -0.30% |
| 30.09.2003 | 100.20 | 99.60 | 0.60 | 0.60% | 99.90 | 0.30 | 0.30% |
| 30.06.2003 | 99.60 | 100.30 | -0.70 | -0.70% | 99.10 | 0.50 | 0.50% |
| 31.03.2003 | 100.30 | 100.20 | 0.10 | 0.10% | 99.00 | 1.30 | 1.31% |
| 31.12.2002 | 100.20 | 99.90 | 0.30 | 0.30% | 99.10 | 1.10 | 1.11% |
| 30.09.2002 | 99.90 | 99.10 | 0.80 | 0.81% | 99.60 | 0.30 | 0.30% |
| 30.06.2002 | 99.10 | 99.00 | 0.10 | 0.10% | 99.80 | -0.70 | -0.70% |
| 31.03.2002 | 99.00 | 99.10 | -0.10 | -0.10% | 99.90 | -0.90 | -0.90% |
| 31.12.2001 | 99.10 | 99.60 | -0.50 | -0.50% | - | - | - |
| 30.09.2001 | 99.60 | 99.80 | -0.20 | -0.20% | - | - | - |
| 30.06.2001 | 99.80 | 99.90 | -0.10 | -0.10% | - | - | - |
| 31.03.2001 | 99.90 | - | - | - | - | - | - |
Graf jako obrázek

Podobné sestavy
Aplikace Ekonomika ČNB ze sekce makroekonomika zobrazuje časové řady hlavních makroekonomických údajů z ekonomiky ČR. Najdete zde přes 10.000 grafů různých hodnot od úrokových sazeb, přes statistiky státního rozpočtu, statistiky ČNB a data zpracovávaná ČSÚ. Data jsou k dispozici obvykle za posledních více než 20 let, od prosince roku 1992. Zdroj dat: ČNB ARAD
Příbuzné stránky
- Vice Industry Token - aktuální a historické ceny kryptoměny Vice Industry Token, graf vývoje ceny kryptoměny Vice Industry Token - 2 dny - měna USD
- Vice Industry Token - aktuální a historické ceny kryptoměny Vice Industry Token, graf vývoje ceny kryptoměny Vice Industry Token - 3 roky - měna USD
- Vice Industry Token - aktuální a historické ceny kryptoměny Vice Industry Token, graf vývoje ceny kryptoměny Vice Industry Token - 1 den - měna USD
- Vice Industry Token - aktuální a historické ceny kryptoměny Vice Industry Token, graf vývoje ceny kryptoměny Vice Industry Token - 1 rok - měna USD
- Save and Gain - aktuální a historické ceny kryptoměny Save and Gain, graf vývoje ceny kryptoměny Save and Gain - 2 dny - měna USD
- Opce in-the-money, at-the-money, out-the-money (slovník Opce) - Slovníky finančních a ekonomických pojmů na Kurzy.cz
- Status of your application - Ministry of the interior of the Czech Republic
- The Abyss - aktuální a historické ceny kryptoměny The Abyss, graf vývoje ceny kryptoměny The Abyss - 2 dny - měna USD
- The Executive Order of the Czech Government – traveling to the Czech Republic is strictly restricted.
- Sport and Leisure - aktuální a historické ceny kryptoměny Sport and Leisure, graf vývoje ceny kryptoměny Sport and Leisure - 3 dny - měna USD
- Circuits of Value - aktuální a historické ceny kryptoměny Circuits of Value, graf vývoje ceny kryptoměny Circuits of Value - 1 den - měna USD
- Coronavirus - Information of MoI - Ministry of the interior of the Czech Republic

