Securities other than shares (Other Funds Balance Sheet) - ekonomika ČNB
Aktualizace dat Securities other than shares (Other Funds Balance Sheet) v této aplikaci skončila 30.6.2023. Aktualizovná data časových řad najdete na stránkách nové aplikace z dat ARAD ČNB
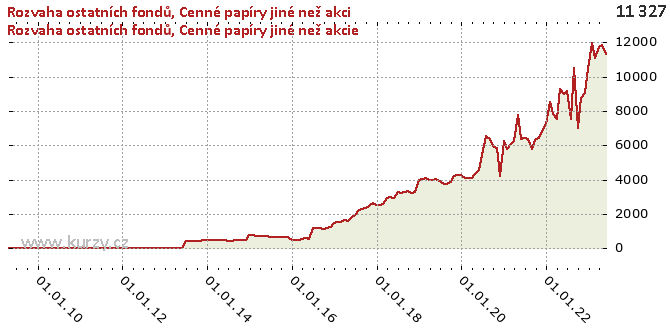
Graf hodnot, Other Funds Balance Sheet
Meziroční srovnání
Minima a maxima
| Typ | Období | Hodnota |
|---|---|---|
| Max | 30.06.2020 | 4 806.47 |
| Min | 31.05.2013 | 31.02 |
Historické hodnoty
| Období | Hodnota | Předchozí | Rozdíl | Změna | Před rokem | Rozdíl | Změna |
|---|---|---|---|---|---|---|---|
| 30.06.2020 | 4 806.47 | 4 555.87 | 250.60 | 5.50% | 3 903.44 | 903.03 | 23.13% |
| 31.05.2020 | 4 555.87 | 4 359.06 | 196.81 | 4.51% | 4 044.13 | 511.74 | 12.65% |
| 30.04.2020 | 4 359.06 | 4 141.60 | 217.47 | 5.25% | 4 004.81 | 354.25 | 8.85% |
| 31.03.2020 | 4 141.60 | 4 180.25 | -38.65 | -0.92% | 3 981.52 | 160.08 | 4.02% |
| 29.02.2020 | 4 180.25 | 4 001.19 | 179.05 | 4.47% | 4 095.28 | 84.97 | 2.07% |
| 31.01.2020 | 4 001.19 | 4 324.68 | - 323.48 | -7.48% | 4 032.88 | -31.69 | -0.79% |
| 31.12.2019 | 4 324.68 | 4 302.82 | 21.86 | 0.51% | 4 002.88 | 321.80 | 8.04% |
| 30.11.2019 | 4 302.82 | 4 234.06 | 68.75 | 1.62% | 3 301.56 | 1 001.26 | 30.33% |
| 31.10.2019 | 4 234.06 | 3 868.14 | 365.93 | 9.46% | 3 213.38 | 1 020.69 | 31.76% |
| 30.09.2019 | 3 868.14 | 3 744.34 | 123.79 | 3.31% | 3 336.32 | 531.82 | 15.94% |
| 31.08.2019 | 3 744.34 | 3 735.98 | 8.36 | 0.22% | 3 261.60 | 482.74 | 14.80% |
| 31.07.2019 | 3 735.98 | 3 903.44 | - 167.46 | -4.29% | 3 234.66 | 501.32 | 15.50% |
| 30.06.2019 | 3 903.44 | 4 044.13 | - 140.68 | -3.48% | 3 278.12 | 625.32 | 19.08% |
| 31.05.2019 | 4 044.13 | 4 004.81 | 39.32 | 0.98% | 2 960.67 | 1 083.46 | 36.59% |
| 30.04.2019 | 4 004.81 | 3 981.52 | 23.29 | 0.58% | 2 997.26 | 1 007.54 | 33.62% |
| 31.03.2019 | 3 981.52 | 4 095.28 | - 113.76 | -2.78% | 2 959.15 | 1 022.37 | 34.55% |
| 28.02.2019 | 4 095.28 | 4 032.88 | 62.40 | 1.55% | 2 606.71 | 1 488.56 | 57.10% |
| 31.01.2019 | 4 032.88 | 4 002.88 | 30.00 | 0.75% | 2 548.12 | 1 484.76 | 58.27% |
| 31.12.2018 | 4 002.88 | 3 301.56 | 701.32 | 21.24% | 2 506.52 | 1 496.36 | 59.70% |
| 30.11.2018 | 3 301.56 | 3 213.38 | 88.18 | 2.74% | 2 623.16 | 678.39 | 25.86% |
| 31.10.2018 | 3 213.38 | 3 336.32 | - 122.94 | -3.68% | 2 454.79 | 758.59 | 30.90% |
| 30.09.2018 | 3 336.32 | 3 261.60 | 74.72 | 2.29% | 2 352.76 | 983.56 | 41.80% |
| 31.08.2018 | 3 261.60 | 3 234.66 | 26.94 | 0.83% | 2 318.85 | 942.75 | 40.66% |
| 31.07.2018 | 3 234.66 | 3 278.12 | -43.47 | -1.33% | 2 249.84 | 984.82 | 43.77% |
| 30.06.2018 | 3 278.12 | 2 960.67 | 317.46 | 10.72% | 1 969.29 | 1 308.83 | 66.46% |
| 31.05.2018 | 2 960.67 | 2 997.26 | -36.60 | -1.22% | 1 818.34 | 1 142.33 | 62.82% |
| 30.04.2018 | 2 997.26 | 2 959.15 | 38.12 | 1.29% | 1 581.32 | 1 415.94 | 89.54% |
| 31.03.2018 | 2 959.15 | 2 606.71 | 352.44 | 13.52% | 1 664.31 | 1 294.84 | 77.80% |
| 28.02.2018 | 2 606.71 | 2 548.12 | 58.59 | 2.30% | 1 560.71 | 1 046.00 | 67.02% |
| 31.01.2018 | 2 548.12 | 2 506.52 | 41.61 | 1.66% | 1 552.20 | 995.92 | 64.16% |
| 31.12.2017 | 2 506.52 | 2 623.16 | - 116.65 | -4.45% | 1 494.80 | 1 011.72 | 67.68% |
| 30.11.2017 | 2 623.16 | 2 454.79 | 168.37 | 6.86% | 1 249.64 | 1 373.53 | 109.91% |
| 31.10.2017 | 2 454.79 | 2 352.76 | 102.03 | 4.34% | 1 175.04 | 1 279.75 | 108.91% |
| 30.09.2017 | 2 352.76 | 2 318.85 | 33.91 | 1.46% | 1 140.70 | 1 212.06 | 106.26% |
| 31.08.2017 | 2 318.85 | 2 249.84 | 69.01 | 3.07% | 1 203.04 | 1 115.81 | 92.75% |
| 31.07.2017 | 2 249.84 | 1 969.29 | 280.55 | 14.25% | 1 191.92 | 1 057.92 | 88.76% |
| 30.06.2017 | 1 969.29 | 1 818.34 | 150.95 | 8.30% | 1 186.59 | 782.71 | 65.96% |
| 31.05.2017 | 1 818.34 | 1 581.32 | 237.02 | 14.99% | 526.56 | 1 291.78 | 245.33% |
| 30.04.2017 | 1 581.32 | 1 664.31 | -82.98 | -4.99% | 592.00 | 989.32 | 167.12% |
| 31.03.2017 | 1 664.31 | 1 560.71 | 103.59 | 6.64% | 522.38 | 1 141.92 | 218.60% |
| 28.02.2017 | 1 560.71 | 1 552.20 | 8.51 | 0.55% | 476.78 | 1 083.93 | 227.34% |
| 31.01.2017 | 1 552.20 | 1 494.80 | 57.41 | 3.84% | 474.27 | 1 077.93 | 227.28% |
| 31.12.2016 | 1 494.80 | 1 249.64 | 245.16 | 19.62% | 477.91 | 1 016.88 | 212.78% |
| 30.11.2016 | 1 249.64 | 1 175.04 | 74.60 | 6.35% | 686.62 | 563.02 | 82.00% |
| 31.10.2016 | 1 175.04 | 1 140.70 | 34.34 | 3.01% | 683.15 | 491.89 | 72.00% |
| 30.09.2016 | 1 140.70 | 1 203.04 | -62.34 | -5.18% | 682.86 | 457.84 | 67.05% |
| 31.08.2016 | 1 203.04 | 1 191.92 | 11.12 | 0.93% | 663.60 | 539.44 | 81.29% |
| 31.07.2016 | 1 191.92 | 1 186.59 | 5.33 | 0.45% | 663.98 | 527.94 | 79.51% |
| 30.06.2016 | 1 186.59 | 526.56 | 660.03 | 125.35% | 665.26 | 521.33 | 78.36% |
| 31.05.2016 | 526.56 | 592.00 | -65.44 | -11.05% | 706.33 | - 179.77 | -25.45% |
| 30.04.2016 | 592.00 | 522.38 | 69.62 | 13.33% | 699.44 | - 107.44 | -15.36% |
| 31.03.2016 | 522.38 | 476.78 | 45.60 | 9.56% | 708.61 | - 186.23 | -26.28% |
| 29.02.2016 | 476.78 | 474.27 | 2.51 | 0.53% | 740.40 | - 263.62 | -35.61% |
| 31.01.2016 | 474.27 | 477.91 | -3.64 | -0.76% | 805.70 | - 331.43 | -41.14% |
| 31.12.2015 | 477.91 | 686.62 | - 208.70 | -30.40% | 776.14 | - 298.23 | -38.42% |
| 30.11.2015 | 686.62 | 683.15 | 3.47 | 0.51% | 480.37 | 206.25 | 42.94% |
| 31.10.2015 | 683.15 | 682.86 | 0.29 | 0.04% | 468.80 | 214.35 | 45.72% |
| 30.09.2015 | 682.86 | 663.60 | 19.26 | 2.90% | 461.99 | 220.87 | 47.81% |
| 31.08.2015 | 663.60 | 663.98 | -0.38 | -0.06% | 462.64 | 200.96 | 43.44% |
| 31.07.2015 | 663.98 | 665.26 | -1.28 | -0.19% | 457.54 | 206.44 | 45.12% |
| 30.06.2015 | 665.26 | 706.33 | -41.07 | -5.81% | 450.92 | 214.34 | 47.53% |
| 31.05.2015 | 706.33 | 699.44 | 6.89 | 0.98% | 512.39 | 193.94 | 37.85% |
| 30.04.2015 | 699.44 | 708.61 | -9.17 | -1.29% | 510.06 | 189.38 | 37.13% |
| 31.03.2015 | 708.61 | 740.40 | -31.80 | -4.29% | 496.05 | 212.55 | 42.85% |
| 28.02.2015 | 740.40 | 805.70 | -65.29 | -8.10% | 490.42 | 249.98 | 50.97% |
| 31.01.2015 | 805.70 | 776.14 | 29.56 | 3.81% | 482.20 | 323.49 | 67.09% |
| 31.12.2014 | 776.14 | 480.37 | 295.77 | 61.57% | 477.40 | 298.73 | 62.57% |
| 30.11.2014 | 480.37 | 468.80 | 11.57 | 2.47% | 477.85 | 2.52 | 0.53% |
| 31.10.2014 | 468.80 | 461.99 | 6.81 | 1.47% | 442.08 | 26.72 | 6.04% |
| 30.09.2014 | 461.99 | 462.64 | -0.65 | -0.14% | 438.68 | 23.31 | 5.31% |
| 31.08.2014 | 462.64 | 457.54 | 5.10 | 1.12% | 434.37 | 28.28 | 6.51% |
| 31.07.2014 | 457.54 | 450.92 | 6.62 | 1.47% | 434.82 | 22.71 | 5.22% |
| 30.06.2014 | 450.92 | 512.39 | -61.47 | -12.00% | 432.85 | 18.07 | 4.17% |
| 31.05.2014 | 512.39 | 510.06 | 2.33 | 0.46% | 31.02 | 481.37 | 1 551.81% |
| 30.04.2014 | 510.06 | 496.05 | 14.01 | 2.82% | 32.88 | 477.18 | 1 451.23% |
| 31.03.2014 | 496.05 | 490.42 | 5.63 | 1.15% | 33.47 | 462.59 | 1 382.26% |
| 28.02.2014 | 490.42 | 482.20 | 8.22 | 1.70% | 33.23 | 457.20 | 1 375.94% |
| 31.01.2014 | 482.20 | 477.40 | 4.80 | 1.01% | 33.44 | 448.77 | 1 342.08% |
| 31.12.2013 | 477.40 | 477.85 | -0.44 | -0.09% | 33.07 | 444.34 | 1 343.79% |
| 30.11.2013 | 477.85 | 442.08 | 35.77 | 8.09% | 0.00 | 477.85 | - |
| 31.10.2013 | 442.08 | 438.68 | 3.40 | 0.78% | 0.00 | 442.08 | - |
| 30.09.2013 | 438.68 | 434.37 | 4.31 | 0.99% | 0.00 | 438.68 | - |
| 31.08.2013 | 434.37 | 434.82 | -0.46 | -0.11% | 0.00 | 434.37 | - |
| 31.07.2013 | 434.82 | 432.85 | 1.98 | 0.46% | 0.00 | 434.82 | - |
| 30.06.2013 | 432.85 | 31.02 | 401.83 | 1 295.39% | 0.00 | 432.85 | - |
| 31.05.2013 | 31.02 | 32.88 | -1.86 | -5.66% | 0.00 | 31.02 | - |
| 30.04.2013 | 32.88 | 33.47 | -0.58 | -1.75% | 0.00 | 32.88 | - |
| 31.03.2013 | 33.47 | 33.23 | 0.24 | 0.72% | 0.00 | 33.47 | - |
| 28.02.2013 | 33.23 | 33.44 | -0.21 | -0.63% | 0.00 | 33.23 | - |
| 31.01.2013 | 33.44 | 33.07 | 0.37 | 1.12% | 0.00 | 33.44 | - |
| 31.12.2012 | 33.07 | 0.00 | 33.07 | - | 0.00 | 33.07 | - |
| 30.11.2012 | 0.00 | 0.00 | 0.00 | - | 0.00 | 0.00 | - |
| 31.10.2012 | 0.00 | 0.00 | 0.00 | - | 0.00 | 0.00 | - |
| 30.09.2012 | 0.00 | 0.00 | 0.00 | - | 0.00 | 0.00 | - |
| 31.08.2012 | 0.00 | 0.00 | 0.00 | - | 0.00 | 0.00 | - |
| 31.07.2012 | 0.00 | 0.00 | 0.00 | - | 0.00 | 0.00 | - |
| 30.06.2012 | 0.00 | 0.00 | 0.00 | - | 0.00 | 0.00 | - |
| 31.05.2012 | 0.00 | 0.00 | 0.00 | - | 0.00 | 0.00 | - |
| 30.04.2012 | 0.00 | 0.00 | 0.00 | - | 0.00 | 0.00 | - |
| 31.03.2012 | 0.00 | 0.00 | 0.00 | - | 0.00 | 0.00 | - |
| 29.02.2012 | 0.00 | 0.00 | 0.00 | - | 0.00 | 0.00 | - |
| 31.01.2012 | 0.00 | 0.00 | 0.00 | - | 0.00 | 0.00 | - |
| 31.12.2011 | 0.00 | 0.00 | 0.00 | - | 0.00 | 0.00 | - |
| 30.11.2011 | 0.00 | 0.00 | 0.00 | - | 0.00 | 0.00 | - |
| 31.10.2011 | 0.00 | 0.00 | 0.00 | - | 0.00 | 0.00 | - |
| 30.09.2011 | 0.00 | 0.00 | 0.00 | - | 0.00 | 0.00 | - |
| 31.08.2011 | 0.00 | 0.00 | 0.00 | - | 0.00 | 0.00 | - |
| 31.07.2011 | 0.00 | 0.00 | 0.00 | - | 0.00 | 0.00 | - |
| 30.06.2011 | 0.00 | 0.00 | 0.00 | - | 0.00 | 0.00 | - |
| 31.05.2011 | 0.00 | 0.00 | 0.00 | - | 0.00 | 0.00 | - |
| 30.04.2011 | 0.00 | 0.00 | 0.00 | - | 0.00 | 0.00 | - |
| 31.03.2011 | 0.00 | 0.00 | 0.00 | - | 0.00 | 0.00 | - |
| 28.02.2011 | 0.00 | 0.00 | 0.00 | - | 0.00 | 0.00 | - |
| 31.01.2011 | 0.00 | 0.00 | 0.00 | - | 0.00 | 0.00 | - |
| 31.12.2010 | 0.00 | 0.00 | 0.00 | - | 0.00 | 0.00 | - |
| 30.11.2010 | 0.00 | 0.00 | 0.00 | - | 0.00 | 0.00 | - |
| 31.10.2010 | 0.00 | 0.00 | 0.00 | - | 0.00 | 0.00 | - |
| 30.09.2010 | 0.00 | 0.00 | 0.00 | - | 0.00 | 0.00 | - |
| 31.08.2010 | 0.00 | 0.00 | 0.00 | - | 0.00 | 0.00 | - |
| 31.07.2010 | 0.00 | 0.00 | 0.00 | - | 0.00 | 0.00 | - |
| 30.06.2010 | 0.00 | 0.00 | 0.00 | - | 0.00 | 0.00 | - |
| 31.05.2010 | 0.00 | 0.00 | 0.00 | - | 0.00 | 0.00 | - |
| 30.04.2010 | 0.00 | 0.00 | 0.00 | - | 0.00 | 0.00 | - |
| 31.03.2010 | 0.00 | 0.00 | 0.00 | - | - | - | - |
| 28.02.2010 | 0.00 | 0.00 | 0.00 | - | - | - | - |
| 31.01.2010 | 0.00 | 0.00 | 0.00 | - | - | - | - |
| 31.12.2009 | 0.00 | 0.00 | 0.00 | - | - | - | - |
| 30.11.2009 | 0.00 | 0.00 | 0.00 | - | - | - | - |
| 31.10.2009 | 0.00 | 0.00 | 0.00 | - | - | - | - |
| 30.09.2009 | 0.00 | 0.00 | 0.00 | - | - | - | - |
| 31.08.2009 | 0.00 | 0.00 | 0.00 | - | - | - | - |
| 31.07.2009 | 0.00 | 0.00 | 0.00 | - | - | - | - |
| 30.06.2009 | 0.00 | 0.00 | 0.00 | - | - | - | - |
| 31.05.2009 | 0.00 | 0.00 | 0.00 | - | - | - | - |
| 30.04.2009 | 0.00 | - | - | - | - | - | - |
Graf jako obrázek

Podobné sestavy
Aplikace Ekonomika ČNB ze sekce makroekonomika zobrazuje časové řady hlavních makroekonomických údajů z ekonomiky ČR. Najdete zde přes 10.000 grafů různých hodnot od úrokových sazeb, přes statistiky státního rozpočtu, statistiky ČNB a data zpracovávaná ČSÚ. Data jsou k dispozici obvykle za posledních více než 20 let, od prosince roku 1992. Zdroj dat: ČNB ARAD

