Securities other than shares (Real Estate Funds Balance Sheet) - ekonomika ČNB
Aktualizace dat Securities other than shares (Real Estate Funds Balance Sheet) v této aplikaci skončila 30.6.2023. Aktualizovná data časových řad najdete na stránkách nové aplikace z dat ARAD ČNB
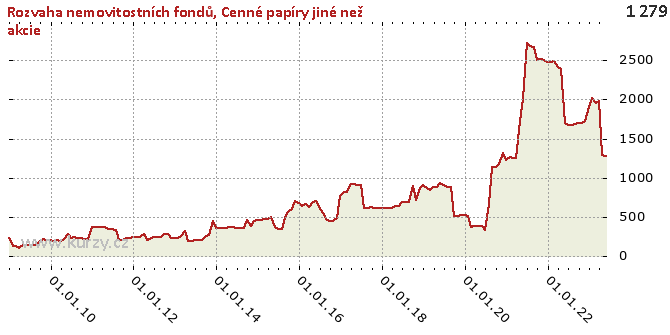
Graf hodnot, Real Estate Funds Balance Sheet
Meziroční srovnání
Minima a maxima
| Typ | Období | Hodnota |
|---|---|---|
| Max | 31.05.2019 | 936.57 |
| Min | 31.03.2009 | 102.27 |
Historické hodnoty
| Období | Hodnota | Předchozí | Rozdíl | Změna | Před rokem | Rozdíl | Změna |
|---|---|---|---|---|---|---|---|
| 30.06.2020 | 331.18 | 381.42 | -50.24 | -13.17% | 912.58 | - 581.40 | -63.71% |
| 31.05.2020 | 381.42 | 381.48 | -0.06 | -0.02% | 936.57 | - 555.15 | -59.27% |
| 30.04.2020 | 381.48 | 381.47 | 0.01 | 0.00% | 879.94 | - 498.46 | -56.65% |
| 31.03.2020 | 381.47 | 378.32 | 3.15 | 0.83% | 878.87 | - 497.40 | -56.60% |
| 29.02.2020 | 378.32 | 521.00 | - 142.68 | -27.39% | 845.35 | - 467.04 | -55.25% |
| 31.01.2020 | 521.00 | 524.32 | -3.32 | -0.63% | 865.70 | - 344.70 | -39.82% |
| 31.12.2019 | 524.32 | 525.71 | -1.39 | -0.26% | 909.50 | - 385.18 | -42.35% |
| 30.11.2019 | 525.71 | 513.04 | 12.67 | 2.47% | 864.73 | - 339.02 | -39.21% |
| 31.10.2019 | 513.04 | 512.41 | 0.63 | 0.12% | 716.83 | - 203.79 | -28.43% |
| 30.09.2019 | 512.41 | 889.04 | - 376.63 | -42.36% | 896.76 | - 384.35 | -42.86% |
| 31.08.2019 | 889.04 | 886.03 | 3.00 | 0.34% | 692.47 | 196.57 | 28.39% |
| 31.07.2019 | 886.03 | 912.58 | -26.55 | -2.91% | 691.30 | 194.73 | 28.17% |
| 30.06.2019 | 912.58 | 936.57 | -23.98 | -2.56% | 692.17 | 220.42 | 31.84% |
| 31.05.2019 | 936.57 | 879.94 | 56.63 | 6.44% | 644.17 | 292.40 | 45.39% |
| 30.04.2019 | 879.94 | 878.87 | 1.07 | 0.12% | 647.11 | 232.83 | 35.98% |
| 31.03.2019 | 878.87 | 845.35 | 33.52 | 3.96% | 616.55 | 262.32 | 42.55% |
| 28.02.2019 | 845.35 | 865.70 | -20.35 | -2.35% | 617.16 | 228.19 | 36.97% |
| 31.01.2019 | 865.70 | 909.50 | -43.80 | -4.82% | 614.76 | 250.95 | 40.82% |
| 31.12.2018 | 909.50 | 864.73 | 44.77 | 5.18% | 614.73 | 294.77 | 47.95% |
| 30.11.2018 | 864.73 | 716.83 | 147.90 | 20.63% | 618.00 | 246.72 | 39.92% |
| 31.10.2018 | 716.83 | 896.76 | - 179.94 | -20.07% | 622.47 | 94.35 | 15.16% |
| 30.09.2018 | 896.76 | 692.47 | 204.29 | 29.50% | 625.85 | 270.92 | 43.29% |
| 31.08.2018 | 692.47 | 691.30 | 1.17 | 0.17% | 614.72 | 77.75 | 12.65% |
| 31.07.2018 | 691.30 | 692.17 | -0.87 | -0.13% | 614.52 | 76.78 | 12.49% |
| 30.06.2018 | 692.17 | 644.17 | 48.00 | 7.45% | 908.95 | - 216.78 | -23.85% |
| 31.05.2018 | 644.17 | 647.11 | -2.94 | -0.45% | 912.06 | - 267.90 | -29.37% |
| 30.04.2018 | 647.11 | 616.55 | 30.56 | 4.96% | 922.72 | - 275.62 | -29.87% |
| 31.03.2018 | 616.55 | 617.16 | -0.61 | -0.10% | 924.50 | - 307.95 | -33.31% |
| 28.02.2018 | 617.16 | 614.76 | 2.41 | 0.39% | 815.12 | - 197.96 | -24.29% |
| 31.01.2018 | 614.76 | 614.73 | 0.03 | 0.00% | 825.99 | - 211.24 | -25.57% |
| 31.12.2017 | 614.73 | 618.00 | -3.27 | -0.53% | 764.08 | - 149.35 | -19.55% |
| 30.11.2017 | 618.00 | 622.47 | -4.47 | -0.72% | 492.68 | 125.33 | 25.44% |
| 31.10.2017 | 622.47 | 625.85 | -3.37 | -0.54% | 453.48 | 168.99 | 37.27% |
| 30.09.2017 | 625.85 | 614.72 | 11.12 | 1.81% | 450.20 | 175.65 | 39.02% |
| 31.08.2017 | 614.72 | 614.52 | 0.20 | 0.03% | 459.18 | 155.54 | 33.87% |
| 31.07.2017 | 614.52 | 908.95 | - 294.43 | -32.39% | 558.73 | 55.79 | 9.98% |
| 30.06.2017 | 908.95 | 912.06 | -3.12 | -0.34% | 607.15 | 301.80 | 49.71% |
| 31.05.2017 | 912.06 | 922.72 | -10.66 | -1.16% | 699.51 | 212.56 | 30.39% |
| 30.04.2017 | 922.72 | 924.50 | -1.78 | -0.19% | 691.71 | 231.02 | 33.40% |
| 31.03.2017 | 924.50 | 815.12 | 109.38 | 13.42% | 631.60 | 292.90 | 46.38% |
| 28.02.2017 | 815.12 | 825.99 | -10.87 | -1.32% | 662.96 | 152.17 | 22.95% |
| 31.01.2017 | 825.99 | 764.08 | 61.91 | 8.10% | 642.35 | 183.65 | 28.59% |
| 31.12.2016 | 764.08 | 492.68 | 271.40 | 55.09% | 675.32 | 88.76 | 13.14% |
| 30.11.2016 | 492.68 | 453.48 | 39.20 | 8.64% | 701.13 | - 208.46 | -29.73% |
| 31.10.2016 | 453.48 | 450.20 | 3.28 | 0.73% | 605.83 | - 152.35 | -25.15% |
| 30.09.2016 | 450.20 | 459.18 | -8.98 | -1.96% | 561.12 | - 110.92 | -19.77% |
| 31.08.2016 | 459.18 | 558.73 | -99.55 | -17.82% | 489.78 | -30.59 | -6.25% |
| 31.07.2016 | 558.73 | 607.15 | -48.42 | -7.97% | 351.85 | 206.89 | 58.80% |
| 30.06.2016 | 607.15 | 699.51 | -92.36 | -13.20% | 351.24 | 255.91 | 72.86% |
| 31.05.2016 | 699.51 | 691.71 | 7.80 | 1.13% | 371.81 | 327.70 | 88.14% |
| 30.04.2016 | 691.71 | 631.60 | 60.11 | 9.52% | 506.92 | 184.79 | 36.45% |
| 31.03.2016 | 631.60 | 662.96 | -31.36 | -4.73% | 475.28 | 156.32 | 32.89% |
| 29.02.2016 | 662.96 | 642.35 | 20.61 | 3.21% | 479.99 | 182.97 | 38.12% |
| 31.01.2016 | 642.35 | 675.32 | -32.98 | -4.88% | 461.79 | 180.56 | 39.10% |
| 31.12.2015 | 675.32 | 701.13 | -25.81 | -3.68% | 462.77 | 212.55 | 45.93% |
| 30.11.2015 | 701.13 | 605.83 | 95.30 | 15.73% | 445.30 | 255.83 | 57.45% |
| 31.10.2015 | 605.83 | 561.12 | 44.71 | 7.97% | 389.11 | 216.72 | 55.70% |
| 30.09.2015 | 561.12 | 489.78 | 71.34 | 14.57% | 465.87 | 95.25 | 20.45% |
| 31.08.2015 | 489.78 | 351.85 | 137.93 | 39.20% | 367.13 | 122.64 | 33.41% |
| 31.07.2015 | 351.85 | 351.24 | 0.60 | 0.17% | 368.20 | -16.36 | -4.44% |
| 30.06.2015 | 351.24 | 371.81 | -20.57 | -5.53% | 358.99 | -7.75 | -2.16% |
| 31.05.2015 | 371.81 | 506.92 | - 135.11 | -26.65% | 371.83 | -0.02 | -0.01% |
| 30.04.2015 | 506.92 | 475.28 | 31.64 | 6.66% | 370.76 | 136.16 | 36.72% |
| 31.03.2015 | 475.28 | 479.99 | -4.71 | -0.98% | 365.96 | 109.32 | 29.87% |
| 28.02.2015 | 479.99 | 461.79 | 18.20 | 3.94% | 359.80 | 120.19 | 33.40% |
| 31.01.2015 | 461.79 | 462.77 | -0.98 | -0.21% | 362.58 | 99.20 | 27.36% |
| 31.12.2014 | 462.77 | 445.30 | 17.47 | 3.92% | 356.17 | 106.60 | 29.93% |
| 30.11.2014 | 445.30 | 389.11 | 56.19 | 14.44% | 446.46 | -1.16 | -0.26% |
| 31.10.2014 | 389.11 | 465.87 | -76.76 | -16.48% | 268.92 | 120.19 | 44.69% |
| 30.09.2014 | 465.87 | 367.13 | 98.74 | 26.89% | 263.06 | 202.81 | 77.10% |
| 31.08.2014 | 367.13 | 368.20 | -1.07 | -0.29% | 205.90 | 161.24 | 78.31% |
| 31.07.2014 | 368.20 | 358.99 | 9.21 | 2.57% | 207.15 | 161.06 | 77.75% |
| 30.06.2014 | 358.99 | 371.83 | -12.84 | -3.45% | 206.27 | 152.72 | 74.04% |
| 31.05.2014 | 371.83 | 370.76 | 1.07 | 0.29% | 193.03 | 178.80 | 92.62% |
| 30.04.2014 | 370.76 | 365.96 | 4.81 | 1.31% | 194.06 | 176.70 | 91.06% |
| 31.03.2014 | 365.96 | 359.80 | 6.16 | 1.71% | 320.14 | 45.82 | 14.31% |
| 28.02.2014 | 359.80 | 362.58 | -2.79 | -0.77% | 258.34 | 101.45 | 39.27% |
| 31.01.2014 | 362.58 | 356.17 | 6.41 | 1.80% | 237.43 | 125.15 | 52.71% |
| 31.12.2013 | 356.17 | 446.46 | -90.29 | -20.22% | 237.16 | 119.02 | 50.18% |
| 30.11.2013 | 446.46 | 268.92 | 177.55 | 66.02% | 237.90 | 208.57 | 87.67% |
| 31.10.2013 | 268.92 | 263.06 | 5.86 | 2.23% | 281.27 | -12.35 | -4.39% |
| 30.09.2013 | 263.06 | 205.90 | 57.16 | 27.76% | 281.10 | -18.04 | -6.42% |
| 31.08.2013 | 205.90 | 207.15 | -1.25 | -0.60% | 249.26 | -43.37 | -17.40% |
| 31.07.2013 | 207.15 | 206.27 | 0.88 | 0.43% | 248.86 | -41.71 | -16.76% |
| 30.06.2013 | 206.27 | 193.03 | 13.23 | 6.86% | 248.65 | -42.38 | -17.04% |
| 31.05.2013 | 193.03 | 194.06 | -1.03 | -0.53% | 221.72 | -28.68 | -12.94% |
| 30.04.2013 | 194.06 | 320.14 | - 126.08 | -39.38% | 209.69 | -15.63 | -7.46% |
| 31.03.2013 | 320.14 | 258.34 | 61.80 | 23.92% | 289.48 | 30.66 | 10.59% |
| 28.02.2013 | 258.34 | 237.43 | 20.91 | 8.81% | 241.75 | 16.60 | 6.86% |
| 31.01.2013 | 237.43 | 237.16 | 0.28 | 0.12% | 241.53 | -4.10 | -1.70% |
| 31.12.2012 | 237.16 | 237.90 | -0.74 | -0.31% | 241.45 | -4.30 | -1.78% |
| 30.11.2012 | 237.90 | 281.27 | -43.37 | -15.42% | 235.91 | 1.99 | 0.84% |
| 31.10.2012 | 281.27 | 281.10 | 0.17 | 0.06% | 239.26 | 42.00 | 17.56% |
| 30.09.2012 | 281.10 | 249.26 | 31.84 | 12.77% | 214.41 | 66.69 | 31.10% |
| 31.08.2012 | 249.26 | 248.86 | 0.40 | 0.16% | 215.38 | 33.88 | 15.73% |
| 31.07.2012 | 248.86 | 248.65 | 0.21 | 0.09% | 342.33 | -93.48 | -27.31% |
| 30.06.2012 | 248.65 | 221.72 | 26.93 | 12.14% | 348.00 | -99.35 | -28.55% |
| 31.05.2012 | 221.72 | 209.69 | 12.03 | 5.73% | 350.08 | - 128.36 | -36.67% |
| 30.04.2012 | 209.69 | 289.48 | -79.79 | -27.56% | 373.42 | - 163.72 | -43.84% |
| 31.03.2012 | 289.48 | 241.75 | 47.73 | 19.75% | 372.95 | -83.47 | -22.38% |
| 29.02.2012 | 241.75 | 241.53 | 0.22 | 0.09% | 378.97 | - 137.22 | -36.21% |
| 31.01.2012 | 241.53 | 241.45 | 0.08 | 0.03% | 377.27 | - 135.74 | -35.98% |
| 31.12.2011 | 241.45 | 235.91 | 5.54 | 2.35% | 369.63 | - 128.18 | -34.68% |
| 30.11.2011 | 235.91 | 239.26 | -3.35 | -1.40% | 220.98 | 14.93 | 6.76% |
| 31.10.2011 | 239.26 | 214.41 | 24.86 | 11.59% | 220.93 | 18.33 | 8.30% |
| 30.09.2011 | 214.41 | 215.38 | -0.97 | -0.45% | 232.12 | -17.71 | -7.63% |
| 31.08.2011 | 215.38 | 342.33 | - 126.96 | -37.09% | 232.19 | -16.81 | -7.24% |
| 31.07.2011 | 342.33 | 348.00 | -5.66 | -1.63% | 250.75 | 91.58 | 36.52% |
| 30.06.2011 | 348.00 | 350.08 | -2.08 | -0.59% | 235.02 | 112.97 | 48.07% |
| 31.05.2011 | 350.08 | 373.42 | -23.34 | -6.25% | 280.72 | 69.36 | 24.71% |
| 30.04.2011 | 373.42 | 372.95 | 0.46 | 0.12% | 223.60 | 149.81 | 67.00% |
| 31.03.2011 | 372.95 | 378.97 | -6.02 | -1.59% | 202.99 | 169.96 | 83.73% |
| 28.02.2011 | 378.97 | 377.27 | 1.69 | 0.45% | 203.09 | 175.87 | 86.60% |
| 31.01.2011 | 377.27 | 369.63 | 7.64 | 2.07% | 200.06 | 177.21 | 88.58% |
| 31.12.2010 | 369.63 | 220.98 | 148.65 | 67.27% | 212.94 | 156.69 | 73.59% |
| 30.11.2010 | 220.98 | 220.93 | 0.04 | 0.02% | 204.12 | 16.85 | 8.26% |
| 31.10.2010 | 220.93 | 232.12 | -11.18 | -4.82% | 224.57 | -3.64 | -1.62% |
| 30.09.2010 | 232.12 | 232.19 | -0.07 | -0.03% | 192.72 | 39.40 | 20.44% |
| 31.08.2010 | 232.19 | 250.75 | -18.56 | -7.40% | 145.46 | 86.73 | 59.63% |
| 31.07.2010 | 250.75 | 235.02 | 15.72 | 6.69% | 150.97 | 99.78 | 66.10% |
| 30.06.2010 | 235.02 | 280.72 | -45.69 | -16.28% | 142.07 | 92.95 | 65.43% |
| 31.05.2010 | 280.72 | 223.60 | 57.11 | 25.54% | 142.25 | 138.47 | 97.34% |
| 30.04.2010 | 223.60 | 202.99 | 20.61 | 10.16% | 141.32 | 82.28 | 58.22% |
| 31.03.2010 | 202.99 | 203.09 | -0.11 | -0.05% | 102.27 | 100.72 | 98.48% |
| 28.02.2010 | 203.09 | 200.06 | 3.03 | 1.51% | 129.52 | 73.57 | 56.80% |
| 31.01.2010 | 200.06 | 212.94 | -12.87 | -6.04% | 135.68 | 64.38 | 47.45% |
| 31.12.2009 | 212.94 | 204.12 | 8.81 | 4.32% | 234.54 | -21.61 | -9.21% |
| 30.11.2009 | 204.12 | 224.57 | -20.44 | -9.10% | - | - | - |
| 31.10.2009 | 224.57 | 192.72 | 31.85 | 16.53% | - | - | - |
| 30.09.2009 | 192.72 | 145.46 | 47.26 | 32.49% | - | - | - |
| 31.08.2009 | 145.46 | 150.97 | -5.51 | -3.65% | - | - | - |
| 31.07.2009 | 150.97 | 142.07 | 8.89 | 6.26% | - | - | - |
| 30.06.2009 | 142.07 | 142.25 | -0.18 | -0.13% | - | - | - |
| 31.05.2009 | 142.25 | 141.32 | 0.93 | 0.66% | - | - | - |
| 30.04.2009 | 141.32 | 102.27 | 39.05 | 38.19% | - | - | - |
| 31.03.2009 | 102.27 | 129.52 | -27.25 | -21.04% | - | - | - |
| 28.02.2009 | 129.52 | 135.68 | -6.16 | -4.54% | - | - | - |
| 31.01.2009 | 135.68 | 234.54 | -98.86 | -42.15% | - | - | - |
| 31.12.2008 | 234.54 | - | - | - | - | - | - |
Graf jako obrázek

Podobné sestavy
Aplikace Ekonomika ČNB ze sekce makroekonomika zobrazuje časové řady hlavních makroekonomických údajů z ekonomiky ČR. Najdete zde přes 10.000 grafů různých hodnot od úrokových sazeb, přes statistiky státního rozpočtu, statistiky ČNB a data zpracovávaná ČSÚ. Data jsou k dispozici obvykle za posledních více než 20 let, od prosince roku 1992. Zdroj dat: ČNB ARAD

